Report Date: 2024-11-12
The TradeWave report for Canadian Dollar/Swiss Franc (CADCHF) highlights a trading opportunity between 2024-11-12 and 2024-12-29. This comprehensive analysis delves into key TradeWave patterns observed in CADCHF‘s price movements during this period. Supported by historical data and insightful charts, this report is designed to aid both novice and experienced investors and traders in identifying potential trading opportunities, managing risks, and making informed decisions.
Load on Wave Viewer
Canadian Dollar/Swiss Franc TradeWave Opportunity Key Informationi
Staying informed about key financial indicators is essential in the ever-evolving market landscape. This report offers a detailed overview of the TradeWave opportunity for CADCHF, presenting vital statistics that assess the quality and potential of this trading opportunity. Below is an explanation of each key statistic to enhance your understanding and utilization of the report.
Symbol
CADCHF is the unique ticker symbol representing the financial instrument analyzed in this report. Symbols are essential identifiers for instruments such as stocks, ETFs, futures, commodities, forex, government bonds, and cryptocurrencies.
Trade Direction
Indicates whether the recommended trade is to go long (buy) or short (sell) the financial instrument. This recommendation is based on the instrument’s performance analysis over the specified date range, signaling the expected price movement.
Date Range
Specifies the period during which CADCHF is analyzed. Understanding the date range helps investors evaluate the instrument’s performance within this timeframe.
Days Held
Represents the recommended holding period for the financial instrument after initiating the trade. This metric assists investors in planning their investment strategy by indicating the duration to maintain their position.
History Years
Denotes the number of years of historical data the report is based on. A longer history provides a more comprehensive view of the instrument’s performance over time.
Securities Group
Categorizes the financial instrument based on similarities such as sector, industry, asset class, or market segment. Understanding the securities group helps investors compare the instrument’s performance against its peers.
Number of Losers
Indicates the number of trades that resulted in losses during the analyzed period. This statistic provides insight into the potential risks associated with the trading strategy.
Number of Winners
Shows the number of trades that yielded profits during the analyzed period, offering a glimpse into the strategy’s potential profitability.
Percent Profitable
Represents the percentage of profitable trades out of the total trades executed. A higher percentage suggests a more effective trading strategy.
Average Profit
Provides an overview of the strategy’s profitability by calculating the average profit per winning trade. When combined with other metrics like the Sharpe Ratio, it helps assess the strategy’s effectiveness.
Average Loss
Displays the average loss per losing trade, aiding investors in understanding the potential downside and managing risk accordingly.
Biggest Winner
Highlights the largest profit from a single trade during the analyzed period. This helps identify the most significant positive outcome of the trading strategy.
Median Profit
Represents the middle value of all profits, offering a clearer picture by reducing the impact of extreme values.
Standard Deviation
Measures the variability of profits and losses. A lower standard deviation indicates more consistent performance, while a higher value suggests greater volatility.
Cumulative Return
Represents the total return on investment over the analyzed period, accounting for all profits and losses. It provides an overall measure of the trading strategy’s success.
Sharpe Ratio
Assesses risk-adjusted returns. A higher Sharpe Ratio indicates that the strategy offers better returns for the level of risk taken.
Trend Long
Reflects the strength of the upward trend in the financial instrument’s recent performance. A higher value suggests strong bullish momentum.
Trend Short
Indicates the strength of the downward trend. A higher value may signal bearish momentum in the instrument’s recent performance.
Summary
The key statistics provided offer a comprehensive overview of CADCHF‘s performance, including historical data, trade recommendations, and risk assessments. By analyzing these metrics, both novice and experienced investors can make informed decisions about buying, selling, or holding the instrument.
Understanding these statistics allows users to evaluate the effectiveness of the trading strategy, compare performance against peers, and optimize their investment approach for better returns.
| Symbol | CADCHF |
| Trade Direction | Short |
| Date Range | Nov12-Dec29 |
| Days Hold | 48 |
| History Years | 10 |
| Securities Group | FOREX LIQUID |
| Num Winners | 9 |
| Num Losers | 1 |
| Percent Profitable | 90% |
| Biggest Winner | 5.7% |
| Avg Loss | -2.88% |
| Avg Gain | 2.55% |
| Median Gain | 1.88% |
| Std Dev | 2.45% |
| Cumulative Return | 21% |
| Sharpe Ratio | 0.55 |
| Trend Long | 90 |
| Trend Short | 10 |
CADCHF Gain/Loss Bar Charti
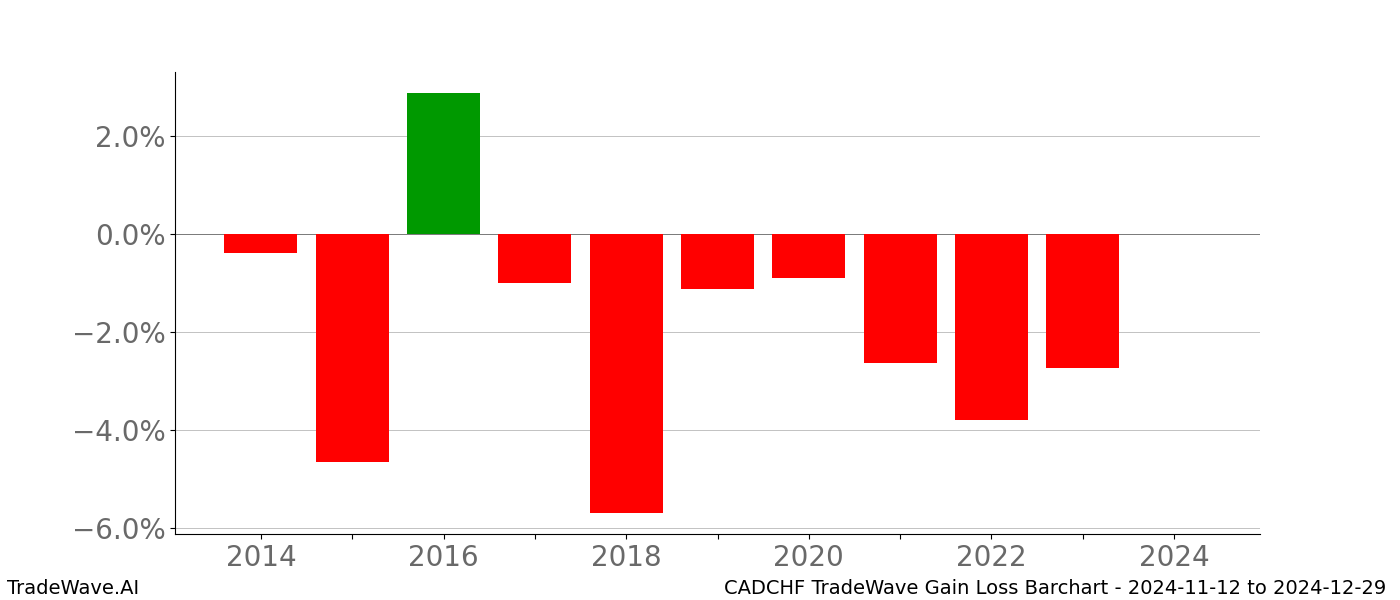
This chart illustrates the profitability of purchasing CADCHF on Nov 12th and selling on Dec 29th. Each bar represents the percentage gain or loss for a specific year. Green bars indicate profitable years, while red bars indicate losses. Consistent green bars suggest a strong bullish TradeWave pattern.
The Sharpe Ratio displayed alongside the chart measures the risk-adjusted return. A higher Sharpe Ratio signifies better returns relative to the risk taken, indicating a more reliable trading strategy.
The bar chart covers a span of 10 years. When evaluating the Sharpe Ratio, consider the number of historical years, as it influences the ratio’s interpretation. Consistently profitable green bars with minimal fluctuation typically indicate a robust TradeWave pattern.
In summary, analyzing the gain/loss bar chart for CADCHF between Nov 12th and Dec 29th provides valuable insights into the consistency and reliability of the trading opportunity.

CADCHF Cumulative Return Charti
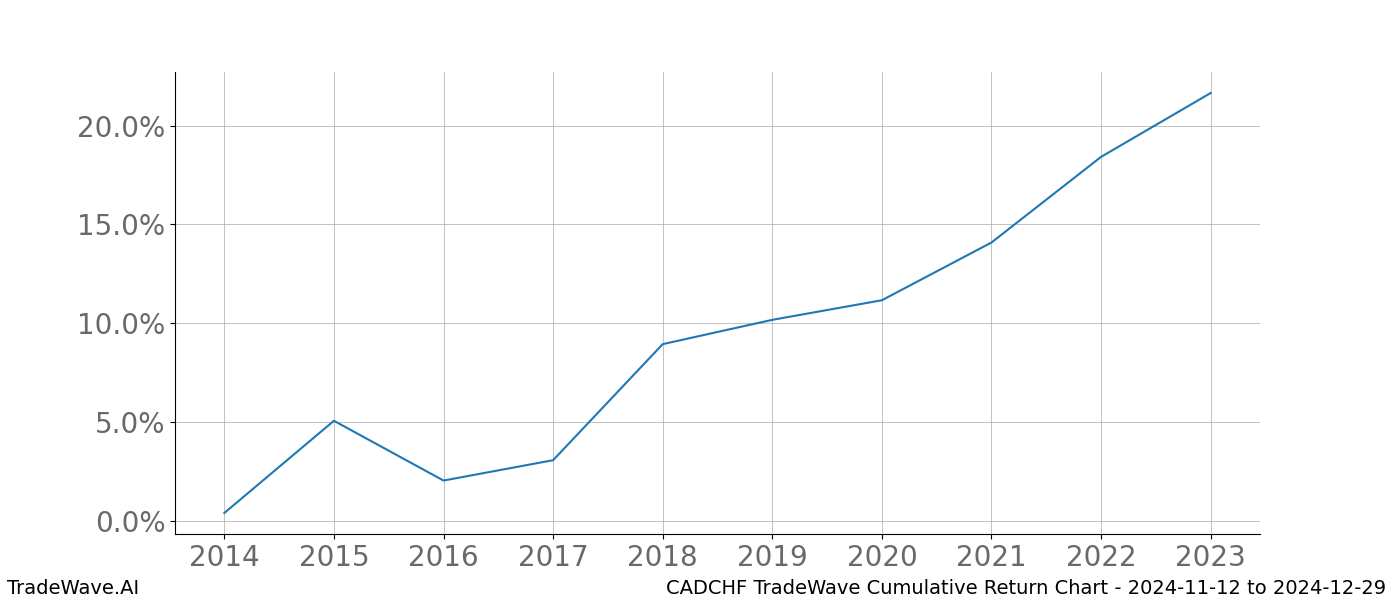
The cumulative return chart showcases the total growth of Canadian Dollar/Swiss Franc (CADCHF) from Nov 12th to Dec 29th over the past years. It visualizes the overall performance, including capital gains and dividends, providing a clear picture of long-term trends.
Investors can compare CADCHF’s performance against other instruments in the same sector or index, identifying which have outperformed or underperformed their peers.
Additionally, the chart aids in evaluating CADCHF’s performance over different periods, helping traders spot trends and make informed buy or sell decisions.

CADCHF 10 Year TradeWave Trend Charti
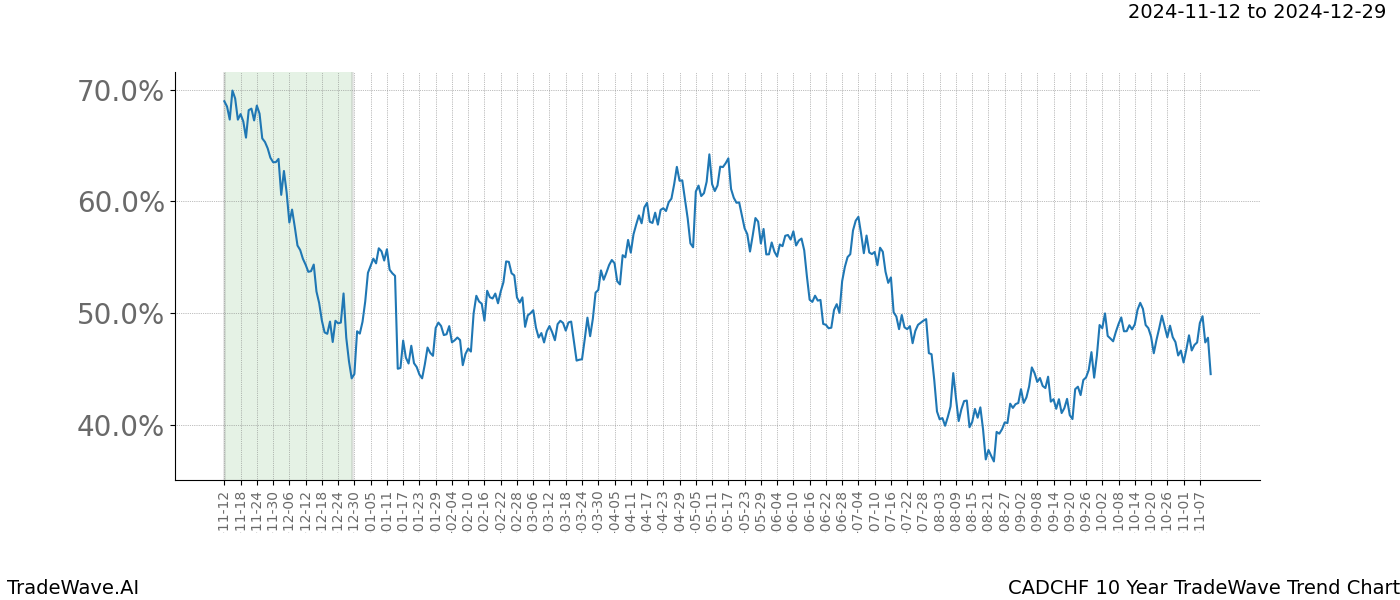
The TradeWave Trend chart for CADCHF over 10 years highlights the average price movement patterns throughout the year. This detrended average helps identify recurring Wave patterns and trends that can inform trading strategies.
The chart displays price movements from January 1st to December 31st, adjusting the initial date to keep the window of opportunity current. This dynamic adjustment ensures that the analysis remains relevant to recent market conditions.
Traders can use this chart to determine optimal entry points by observing how the current date range aligns with historical trends. Adjusting the window of opportunity can provide deeper insights into potential improvements in profitability and risk management.
Overall, the TradeWave Trend chart is a vital tool for understanding CADCHF‘s price behavior, enabling traders to make data-driven decisions based on historical and current market trends.

Investors and traders are always seeking ways to gain an edge in the markets. TradeWave analysis is one such approach that examines historical patterns in an asset’s price movements during specific times of the year. TradeWave.AI offers specialized reports to help identify these potential trading opportunities.
By leveraging TradeWave analysis, investors can anticipate market movements influenced by factors like seasonal trends, economic events, or geopolitical developments. This foresight allows for strategic adjustments to portfolios, enhancing the potential for better returns.
The TradeWave report provides a thorough analysis of CADCHF‘s historical price movements within the specified date range. It also offers insights into related assets or markets, helping traders understand broader market dynamics. However, it’s important to remember that past performance does not guarantee future results. Market conditions can change, and historical patterns may not always predict future outcomes.
TradeWave.AI equips investors and traders with the tools and information needed to understand and utilize TradeWave patterns effectively. By integrating these insights into their trading strategies, users can enhance their decision-making process and potentially achieve better investment outcomes.
Top 10 Today
Wave Viewer: Discover Trading Opportunities for All Financial Instruments
TradeWave Analytics 101
