LEARN TRADEWAVE
EASILY FIND ALL TRADEWAVE OPPORTUNITIES IN ALL MARKETS
What are Waves?
Waves are what we call seasonal patterns in the financial markets. They represent the natural ebb and flow of a security’s price during specific times of the year, based on historical data. These waves indicate that a stock or other asset tends to move in a particular direction during certain periods. For example, a wave could show a security consistently rising in value during the first quarter or dipping in the last two weeks of the year.
Sharpe Ratio Simplified
The Sharpe Ratio is a way to measure how good an investment’s returns are compared to its risk. Think of it like a “bang for your buck” calculation. It tells you how much return (or profit) you get for every unit of risk you take.
Imagine you have two investments:
- Investment A makes $10 profit but has a very stable performance.
- Investment B also makes $10 profit but has wild ups and downs.
The Sharpe Ratio helps you see that Investment A is better because you get the same return with less risk. It’s like comparing two cars with the same speed but one has a much smoother ride.
In TradeWave, the Sharpe Ratio helps rank waves so you can quickly spot the ones that have provided the best balance of return and risk over the years.
Find The Best Waves With TradeWave
TradeWave has analyzed over a Trillion data points to identify the absolute best waves for any day of the year. Whether you want to start analyzing today, tomorrow, or any other date, TradeWave can show you high-probability trading patterns that have consistently occurred over the past 10 or more years.
The default analysis is set to 10 years, but you can customize it to fit your needs. Want to see patterns over the last 14 years? No problem. Curious about a 23-year trend? You got it. The power is in your hands to decide how many years you want to analyze, as long as the data is available.
TradeWave’s Opportunities Table acts like a dynamic almanac, showing you these patterns ranked by their Sharpe Ratio, so you can focus on the most reliable opportunities.
Understanding the Opportunities Table
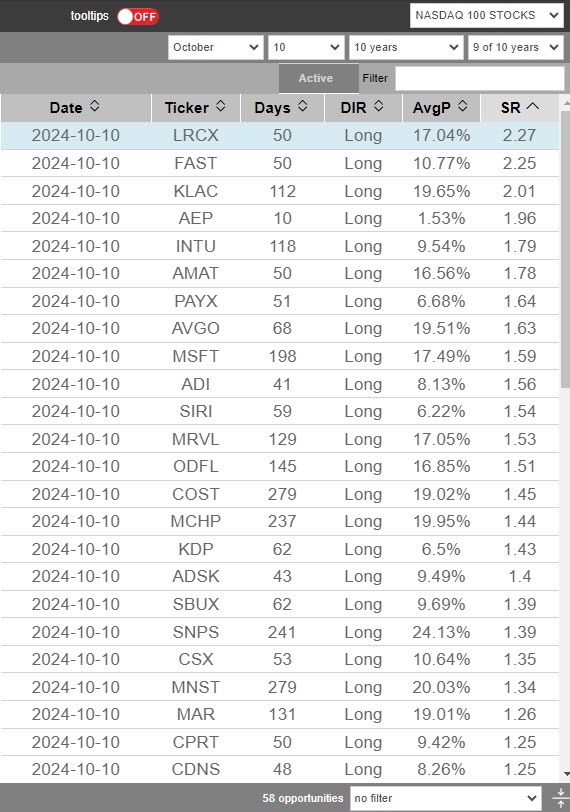
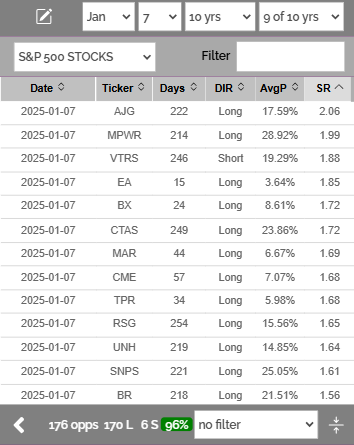
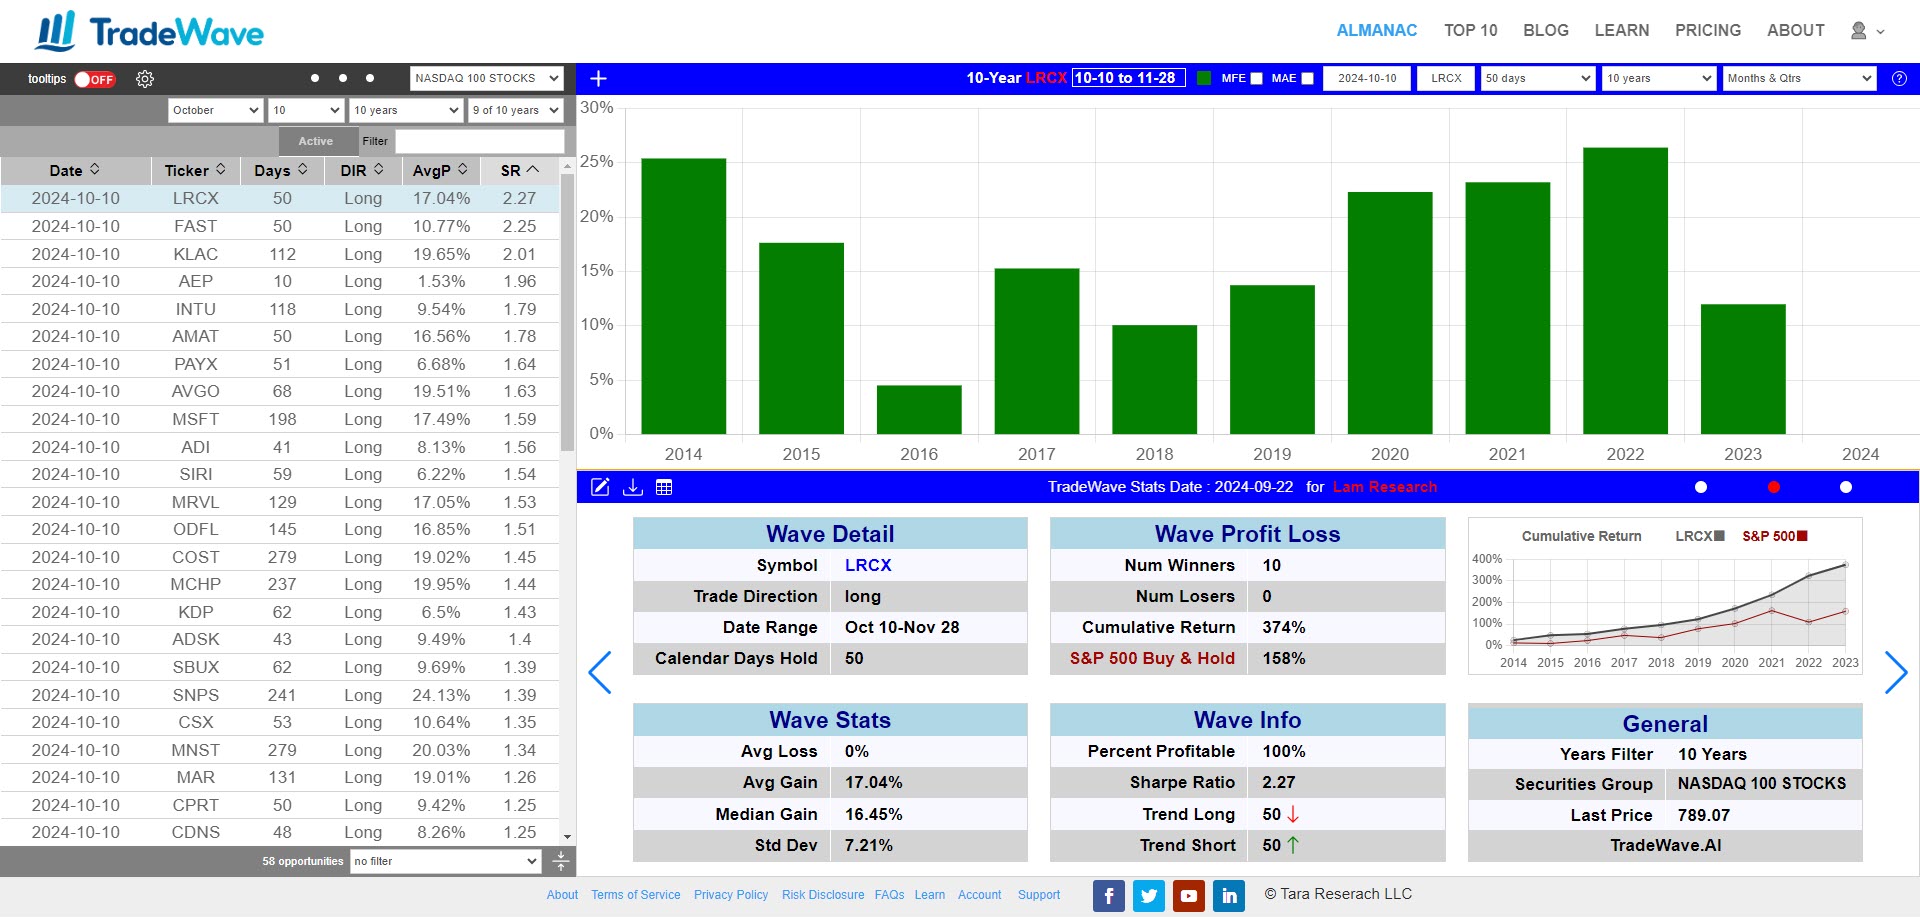
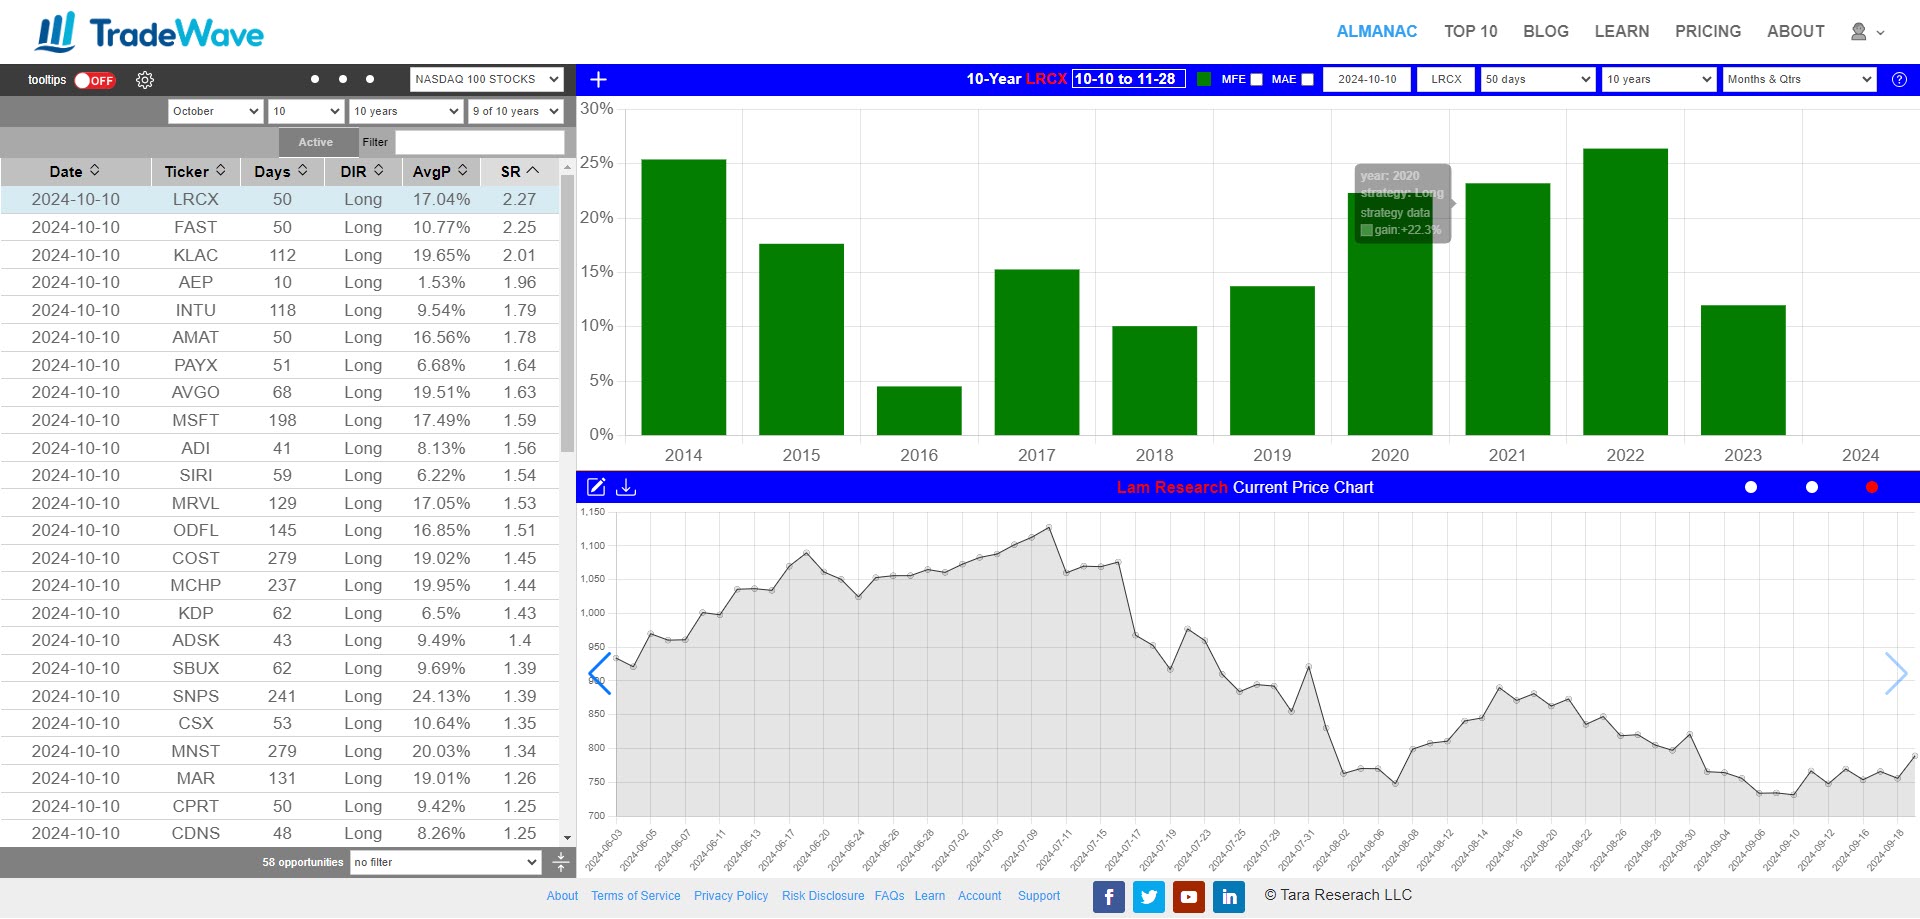
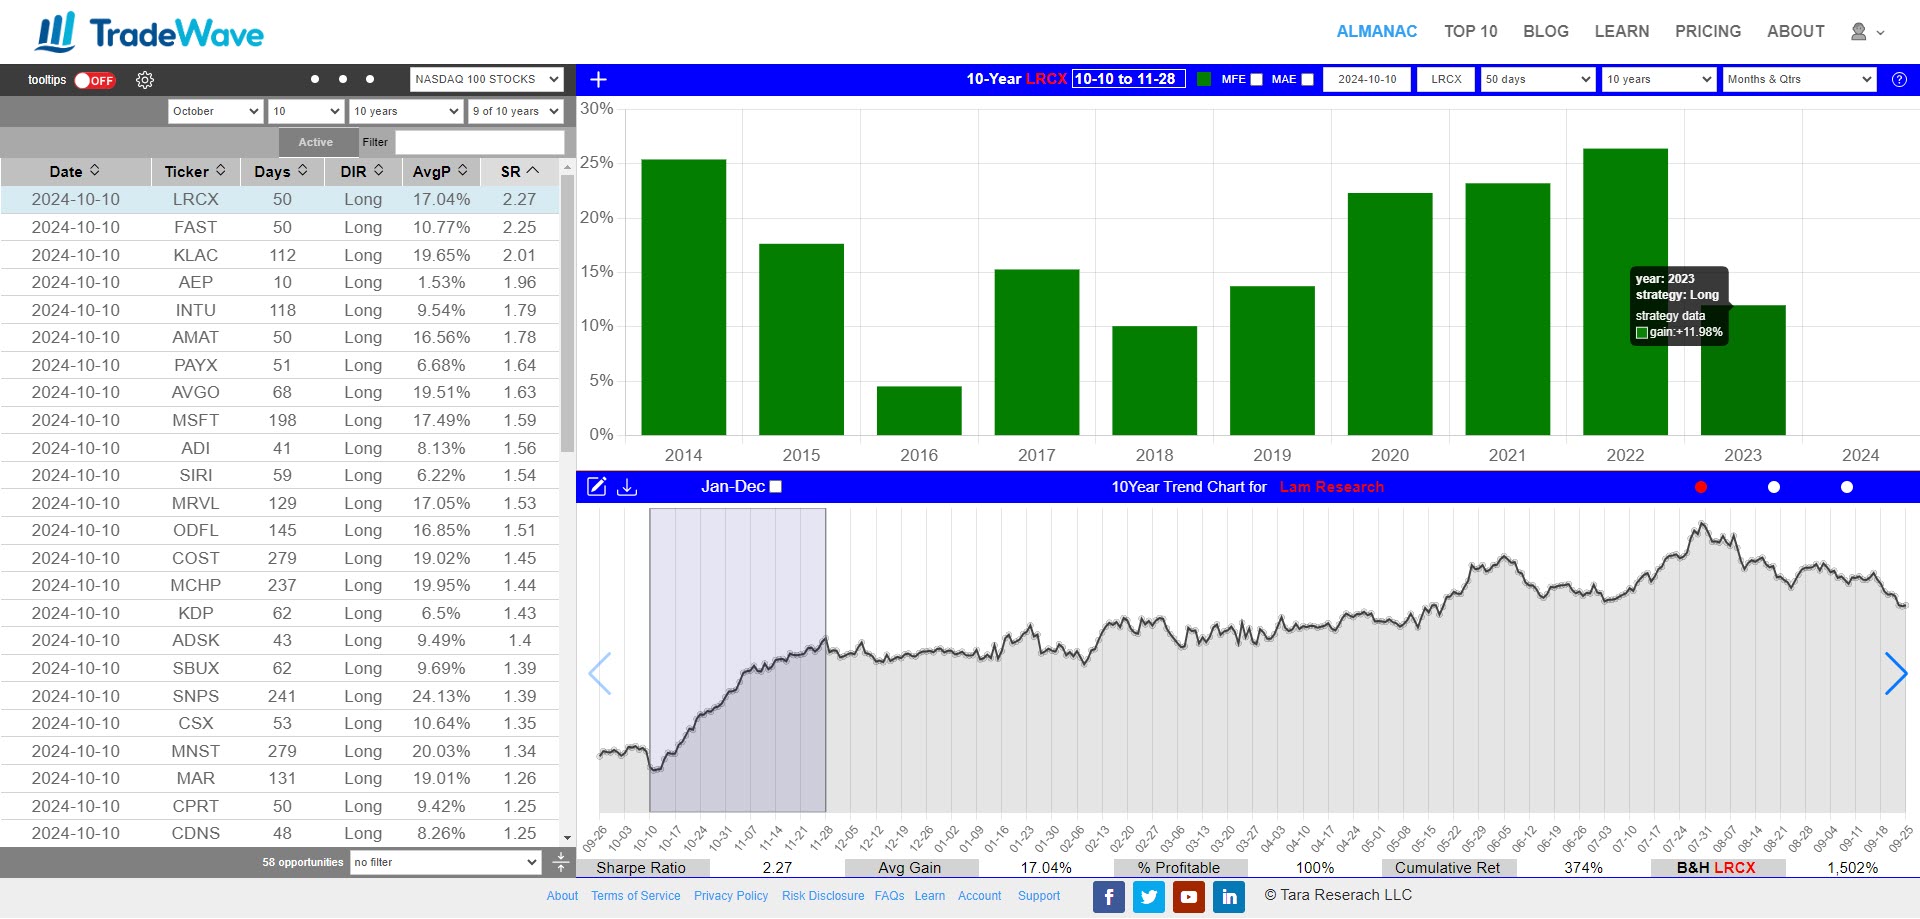
The Opportunities Table provides a quick overview of the best trading waves for each security. Here, we have the NASDAQ Opportunities Table with LRCX (Lam Research Corporation) highlighted.
- Date: The start and end dates for the wave, showing when this pattern has historically occurred.
- Ticker: The stock symbol of the security, in this case, LRCX, representing Lam Research Corporation.
- Days: The number of days the wave typically lasts, giving you an idea of the time frame for the pattern.
- DIR (Direction): Indicates whether the wave is expected to move upward or downward, helping you understand the trend direction.
- AvgP (Average Performance): The average percentage gain or loss during this wave in the past years, showing you the expected return.
- SR (Sharpe Ratio): A higher SR means a better return relative to risk, helping you identify the most consistent and reliable waves.
Each opportunity in this table is clickable. When you click on an entry, it loads directly into the Wave Viewer, displaying detailed information about that specific wave. The highlighted LRCX opportunity will open in the Wave Viewer, allowing you to explore its historical performance and gain deeper insights at a glance.
Exploring the Wave Viewer
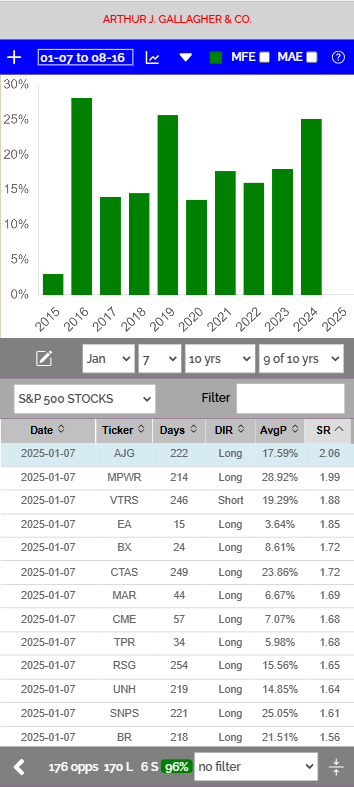
The Wave Viewer is your go-to tool for in-depth analysis of trading waves. There are two simple ways to load a wave:
- Click an Opportunity: Select any opportunity from the Opportunities Table, and the Wave Viewer will automatically load its details, making it easy to explore the wave’s historical performance.
- Set Custom Parameters: You can also manually set the Start Date, Ticker, Days, and Years Analyzed directly in the Wave Viewer. This allows you to create and view any custom wave pattern for any security.
For a more interactive experience, you can customize the Opportunities Table:
- View the Trend Chart: Click the left navigation dot on the horizontal blue ribbon to display the Trend Chart at the bottom. This chart shows you the big picture trend, making it easier to adjust your analysis.
- Adjust the Opportunities Table: Drag the left side of the table to change the start date and the right side to modify the number of days or end date of the date range. This flexibility lets you fine-tune the wave parameters with just a few clicks.
Additionally, you’ll find helpful features on the horizontal blue ribbon:
- Download Options: Use the “Download JPG” button to save a screenshot of your analysis or the “Download CSV” button to export data for further review. Downloading CSV is only available when viewing the Stats Table – Click the center navigation dot to view the Stats Table.
- Portfolio Icon: The leftmost icon on the ribbon lets you add the current wave to your portfolio, enabling you to track and manage your favorite opportunities with ease.
Understanding the Stats Table

Understanding the Current Price Chart
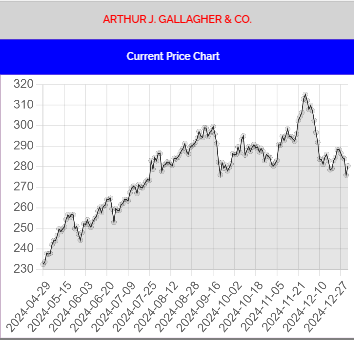
The Current Price Chart displays the recent price movements of the security, helping you track its short-term trends and market behavior.
-
Accessing the Current Price Chart: If the chart is not visible, click the right navigation dot on the horizontal blue ribbon to bring it up. This ensures you have the most recent price data at your fingertips.
-
Visualize Recent Trends: This chart helps you see how the security is performing right now, allowing you to compare current price action against the historical wave patterns identified in the Stats Table and Wave Viewer.
-
Making Informed Decisions: By combining the information from the Current Price Chart with historical data, you can make more confident decisions about entering or exiting trades based on the latest market conditions.
The Current Price Chart is essential for staying up-to-date on a security’s performance and aligning your trading strategy with current trends.
Understanding Historical Price Charts
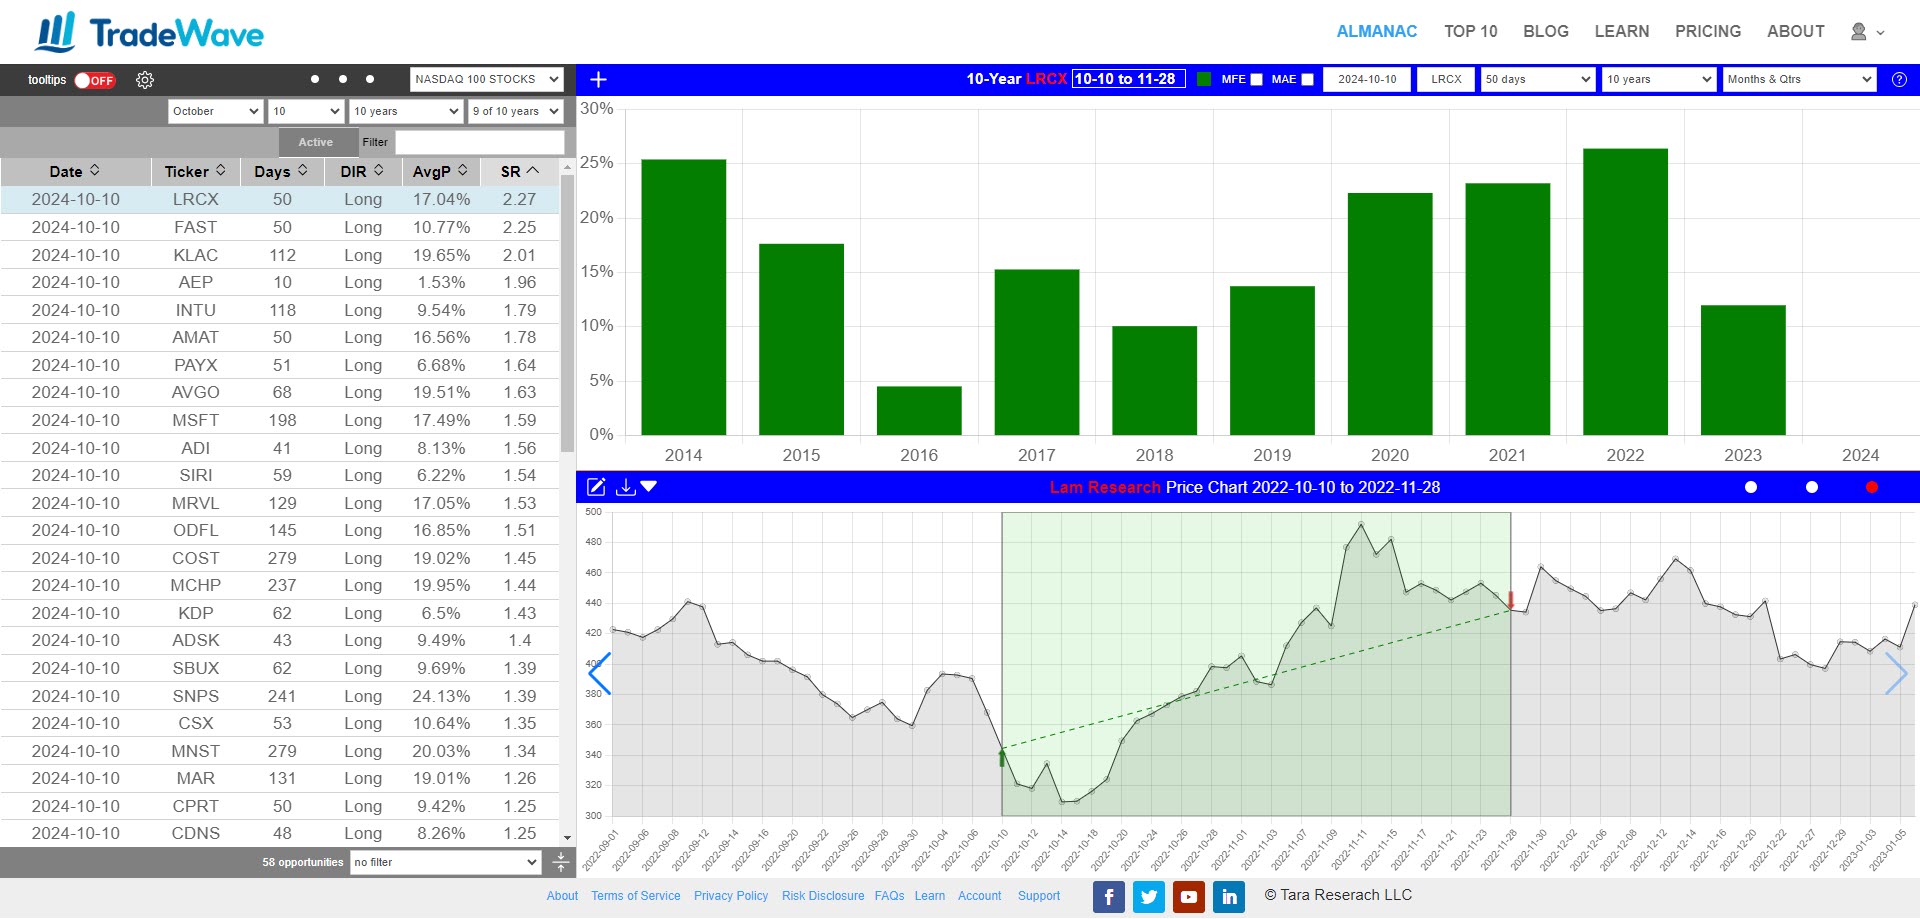
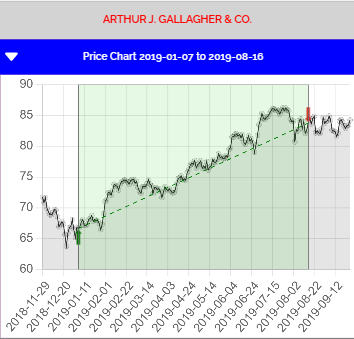
The Historical Price Chart provides a detailed view of a security’s price movements during a specific year, helping you analyze its behavior under various market conditions.
-
Accessing the Historical Price Chart: Click on any bar in the bar chart to display the Historical Price Chart for that particular year. For example, if you click the bar for 2022, the chart will show the security’s performance throughout 2022. TradeWave will automatically switch to the right navigation dot to display the chart. You can also manually access this chart by clicking the right navigation dot on the horizontal blue ribbon.
-
Year-by-Year Analysis: Each time you click a bar, you get a snapshot of the security’s performance during that specific year. This allows you to see how the security responded to various economic events and market trends in that year.
-
Deeper Insights: By comparing different years, you can identify recurring patterns, seasonal influences, or unique events that impacted the security’s price. This information is invaluable for developing a comprehensive trading strategy.
The Historical Price Chart is a powerful tool for diving deep into a security’s performance, providing the context needed to make informed trading decisions.
Understanding the Trend Chart
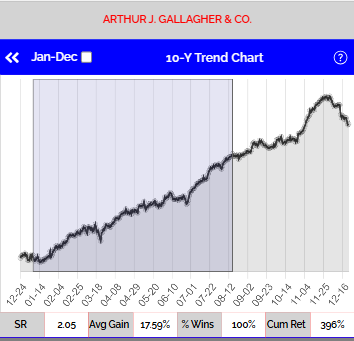
The Trend Chart helps you identify the overall seasonal trend of a security throughout the year. It combines historical data from multiple years to show how a security typically moves during each period, providing insights into potential high-probability trading opportunities.
Key Elements of the Trend Chart:
-
- Overall Trend: The chart displays the average performance of the security over the selected years. A sharp uptrend or downtrend indicates strong seasonal patterns, while a sideways movement suggests a random or less reliable trend.
- Seasonal Patterns: The Trend Chart highlights specific timeframes when the security has historically shown strong upward or downward movements. This information can help you spot potential entry and exit points based on past performance.
- Detrending: The chart is calculated by detrending the performance for each year, removing the influence of long-term growth or decline. This ensures that the chart reflects seasonal trends rather than long-term movements.
- Visual Cues: Color-coded bars on the chart represent different years, making it easy to compare how consistent the seasonal pattern has been over time. A clear, repeated pattern across multiple years suggests a higher probability of similar performance in the future.
How to Access the Trend Chart:
On Desktops, to view the Trend Chart, click the left navigation dot on the horizontal blue ribbon at the top of the screen. This will bring up the Trend Chart display, giving you immediate access to the historical seasonal trends of the selected security.
On Mobile, to view the Trend Chart, swipe the top chart left or right to bring up the Trend Chart display.
How to Use the Trend Chart:
-
- Identify Trading Opportunities: Look for consistent trends during specific months or quarters. If the chart shows a strong uptrend every March, for example, this might be a good time to consider a long position.
- Assess Trend Strength: Use the height of the bars to gauge the strength of the trend. Taller bars indicate stronger seasonal movements, which could signal a more reliable trading opportunity.
- Combine with Other Analysis: The Trend Chart should be used in conjunction with other tools, such as the Stats Table and Historical Price Chart, to form a comprehensive view of the security’s potential performance.
Using the Portfolio Manager
The Portfolio Manager allows you to track, manage, and analyze your selected trading opportunities. Here’s how to add opportunities and navigate through the Portfolio Manager effectively.
Adding Opportunities to the Portfolio
-
- Find an Opportunity: Start by browsing the Opportunities Table. Select the opportunity you’re interested in and load it on the Wave Viewer.
- Add to Portfolio: Click the “+” icon on the top left of the Wave Viewer to add the current opportunity to your portfolio.
- Direct Customization: You can also modify any date range directly on the Wave Viewer and save it to your portfolio. This means you’re not limited to opportunities listed on the Opportunities Table.
Accessing the Portfolio Manager
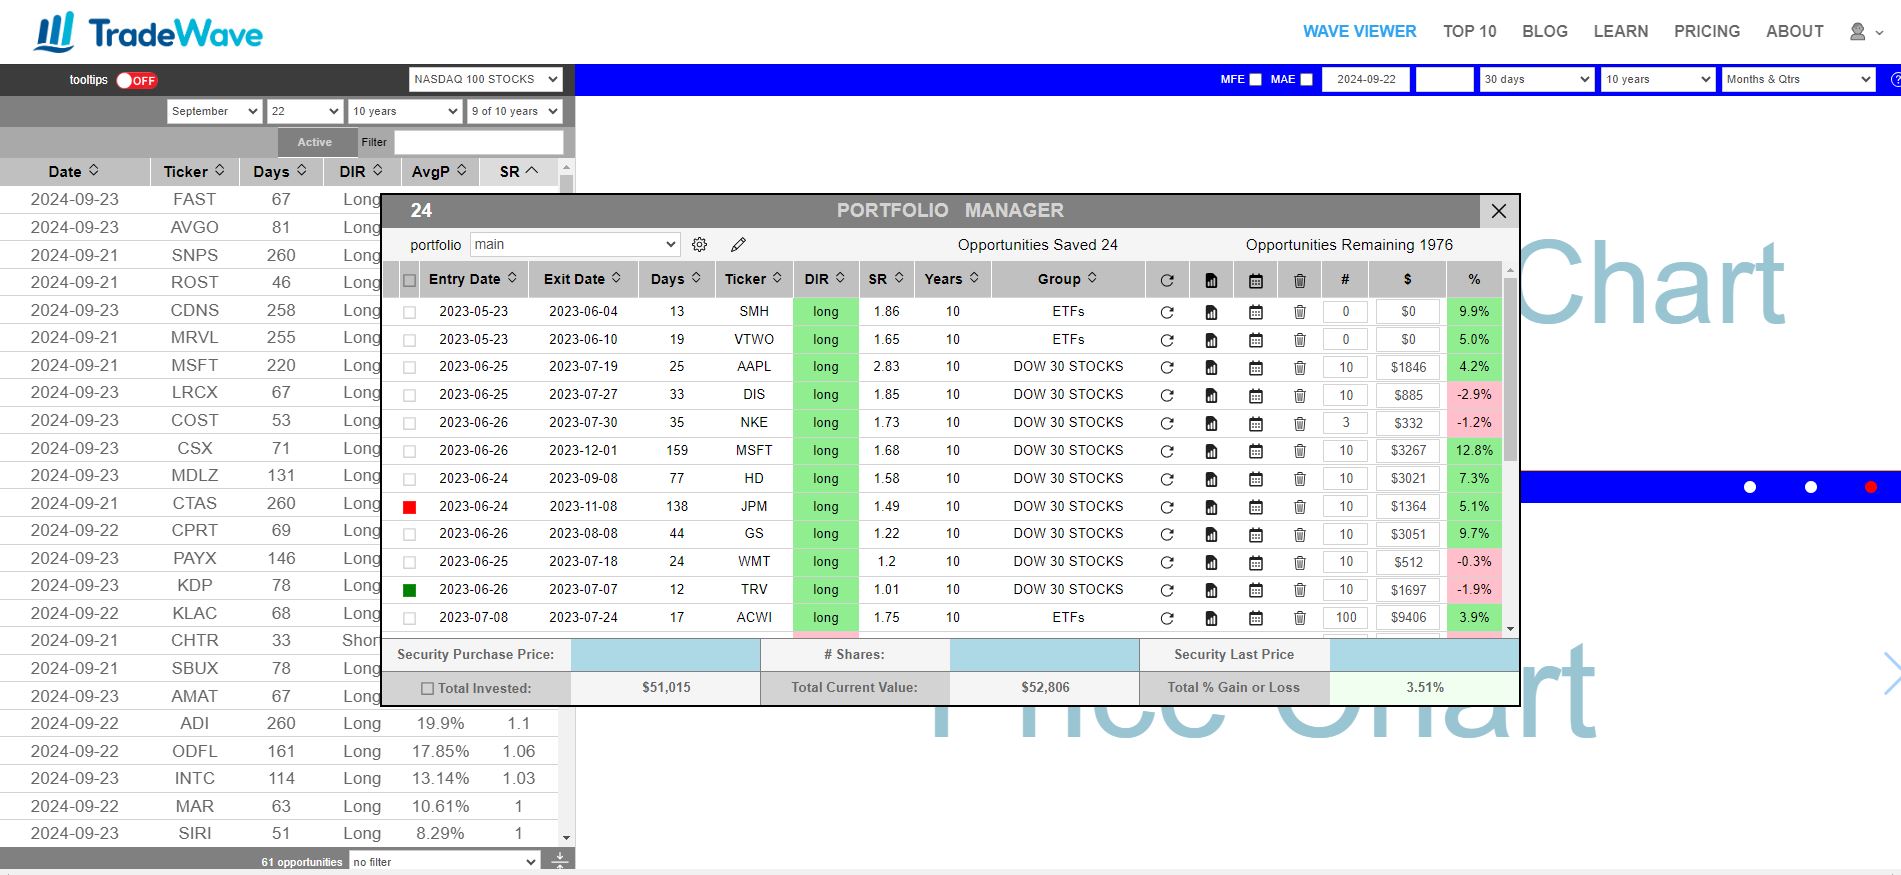
To access the Portfolio Manager, click the portfolio icon (shown in the attached image) on the center horizantal bar on the left side of the bar. This will open the Portfolio Manager view, where you can see all your saved opportunities.
Navigating the Portfolio Manager
-
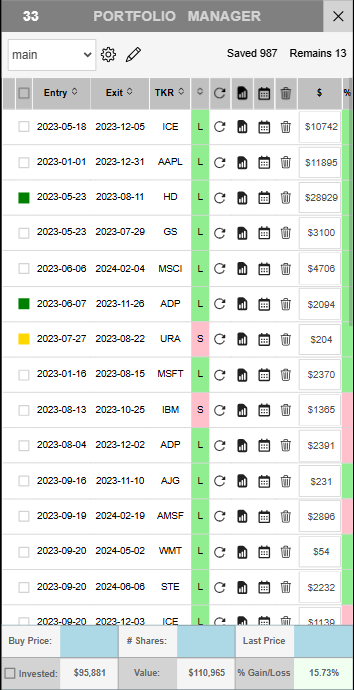
- Portfolio Selection: Use the drop-down menu at the top to select a portfolio. The settings button allows you to create a new portfolio or delete an existing one.
- Portfolio Notes: Click the pencil icon to add notes or descriptions for your selected portfolio.
- Saved Opportunities: Each row represents a saved opportunity. The initial columns show details such as entry and exit dates, ticker, direction, and performance metrics.
- Operation Icons: There are four icons for each row:
- Recall: Loads the saved opportunity back to the Wave Viewer.
- Custom Report: Generates a detailed, shareable report for the selected opportunity. You can share links to these reports via email or social media.
- Notifications: Integrates with Google Calendar to set reminders for the start and end dates of the selected date range.
- Delete: Removes the opportunity from the portfolio.
- Shares and Investment: Use the text boxes to enter the number of shares and investment amount for each opportunity.
- P&L Display: The last column shows the profit and loss (P&L) for each opportunity, helping you monitor performance at a glance.
Portfolio Manager Bottom Rows
- Highlighted Opportunity Details: The first row at the bottom of the Portfolio Manager displays detailed information about the highlighted opportunity, including entry/exit dates, ticker, and performance.
- Overall Portfolio P&L: The second row shows the total profit and loss for the entire portfolio, giving you a quick overview of your overall performance.
With these tools, the Portfolio Manager makes it easy to keep track of your trading strategies, review performance, and make adjustments as needed.
