Live Cattle (LE) heads toward a historically strong seasonal window
Live Cattle futures are trading against a backdrop of tight U.S. cattle supplies and steady beef demand as the market approaches a historically strong 125-day seasonal stretch that starts in early December.
Key takeaways
- A 125-day seasonal window for Live Cattle begins on Dec 6 and has historically been a strong period for prices over a 44-year sample.
- The pattern is aligned with a long trade direction, with 82% profitable years across 36 winners and 8 losers in the historical record.
- Winning years have posted an average gain of 8.8%, while the all-years average, including losing seasons, is 5%, highlighting consistent upside but not a guarantee.
- Past episodes include sizeable intraperiod swings, including a year when Live Cattle fell more than 20% from entry to exit despite an early rally, underlining the role of drawdowns.
- Tight cattle supplies, softer U.S. beef production, and shifting consumer demand will shape how closely this upcoming window tracks the historical pattern.
Price and near-term drivers
Front-month Live Cattle futures have been supported in recent weeks by historically tight U.S. cattle inventories and expectations that supplies will remain constrained into 2026 as ranchers rebuild herds after prolonged drought in key producing regions.[1] The U.S. Department of Agriculture has projected that U.S. beef production will decline in 2025 compared with recent peaks, reflecting smaller cattle numbers and lighter marketings, a backdrop that tends to underpin cattle prices when demand stays resilient.[2]
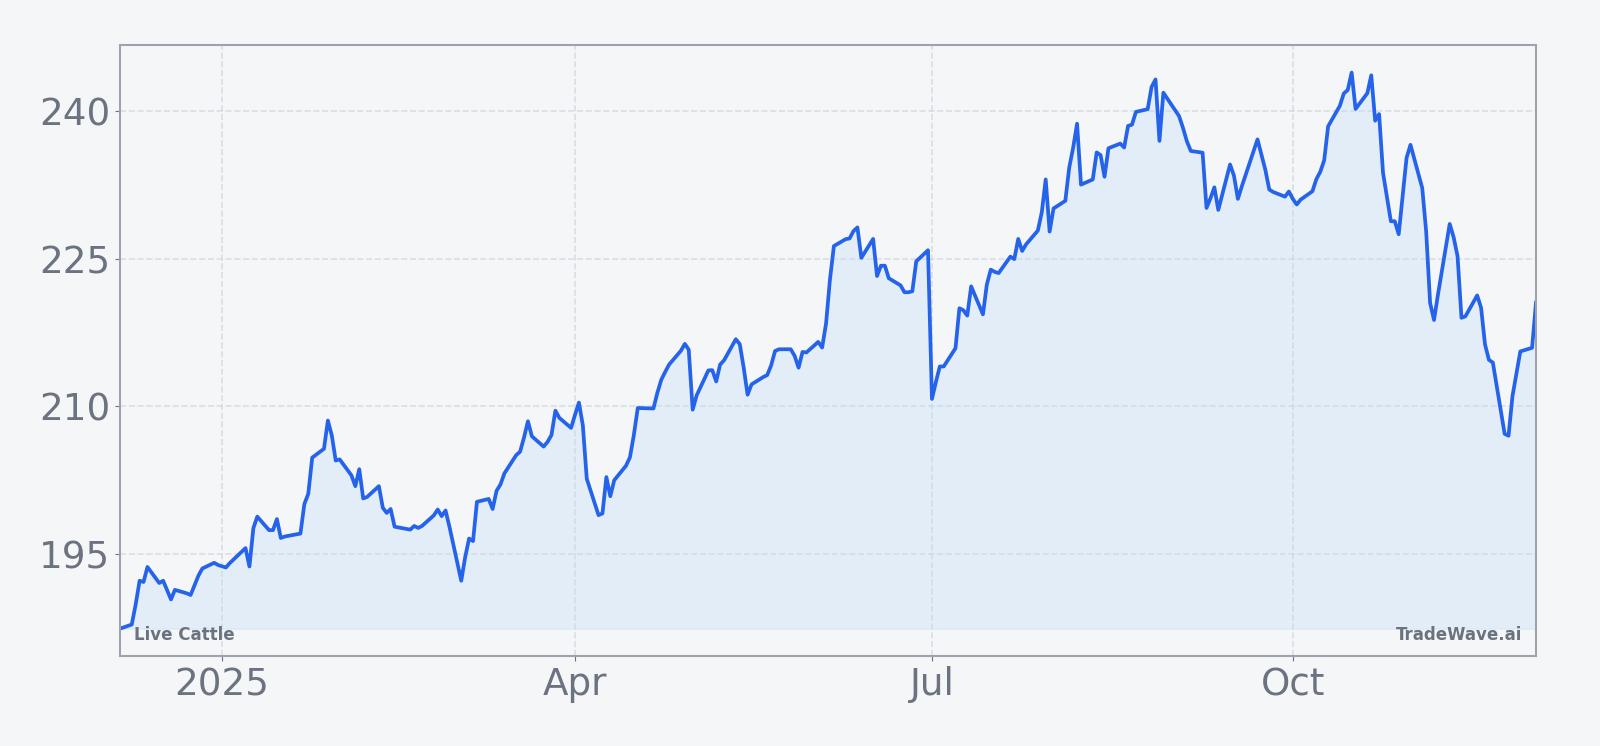
The chart below situates the latest moves in Live Cattle within the past year of trading.
On the demand side, wholesale beef prices have been underpinned by steady domestic consumption and firm export interest, even as inflation pressures and shifting consumer preferences have encouraged some substitution toward cheaper proteins such as pork and poultry.[3] Retail beef prices in the United States remain elevated by historical standards, reflecting both supply tightness and higher processing and transportation costs, though there are signs that price growth has cooled alongside broader food inflation in recent months.[4]
Macro conditions also matter for Live Cattle, since consumer spending power and restaurant traffic are sensitive to interest rates, real wages, and overall growth. U.S. Treasury yields have eased from their 2023 peaks as markets price in the possibility that the Federal Reserve is near the end of its tightening cycle, which could support discretionary spending on higher-priced cuts of beef if labor markets remain firm.[5] At the same time, the U.S. dollar has traded off its strongest levels of the past two years, a development that can make U.S. beef somewhat more competitive in export markets when sustained.[6]
Positioning data from the Commodity Futures Trading Commission show that money managers in Live Cattle have held a net long stance in recent weeks, reflecting constructive sentiment but not extreme speculative exposure by historical standards.[7] Commercial hedgers, including packers and producers, have been active users of the futures and options markets to manage revenue and input risk, particularly in the wake of price volatility seen during prior supply shocks and pandemic-era disruptions.[8]
According to historical data from TradeWave.ai, the upcoming stretch on the Live Cattle calendar has shown a distinct seasonal bias in prior years, offering a quantitative backdrop for today’s fundamentally driven moves.
Seasonal window
This seasonal window begins on 2025-12-06 and spans 125 days. Historically, during this period, Live Cattle has shown a strong upside tendency aligned with a long trade direction across more than four decades of data. In this context, the current environment of tight U.S. cattle supplies and firm beef demand gives traders an additional lens through which to view the upcoming seasonal phase, even as near-term pricing reflects daily shifts in macro expectations and supply and demand news.[1]
Across the 44-year lookback for this pattern, Live Cattle has aligned with its long trade direction in 82% of years, with 36 winners and 8 losers. The fact that winning seasons have delivered an average gain of 8.8% while the all-years average, including losing episodes, is 5% illustrates both the consistency of upside outcomes and the dampening effect of the occasional weak year.
The distribution of annual outcomes includes standout positive seasons and a small number of sharp drawdowns. For example, in 2015 and 2016, the window produced net gains of 10.24% in each year, with maximum favorable moves from entry of 16.67% and 15.72% respectively, while maximum adverse moves during those windows were held to -3.82% and -2.29%. By contrast, 2019 was the weakest year in the sample, with a net return of -21.8% over the window, a maximum favorable move of 6.11%, and a maximum adverse move of -30.26%, highlighting that downside excursions can be severe when the pattern fails to align with supportive fundamentals.
More recent years show how the pattern has behaved in the current cattle supply regime. In 2020, the window delivered a net gain of 14.28%, with a maximum favorable move of 15.35% and a relatively modest maximum adverse move of -0.79%. In 2022, the window posted a 13.08% net gain, with a maximum favorable excursion of 13.35% and worst drawdown of -0.21%. In 2024, Live Cattle recorded an 8.23% net return over the window, with a maximum favorable move of 12.68% and essentially no observed adverse excursion from the entry price in the pattern sample, underscoring how supportive fundamentals can translate into smooth seasonal behavior.
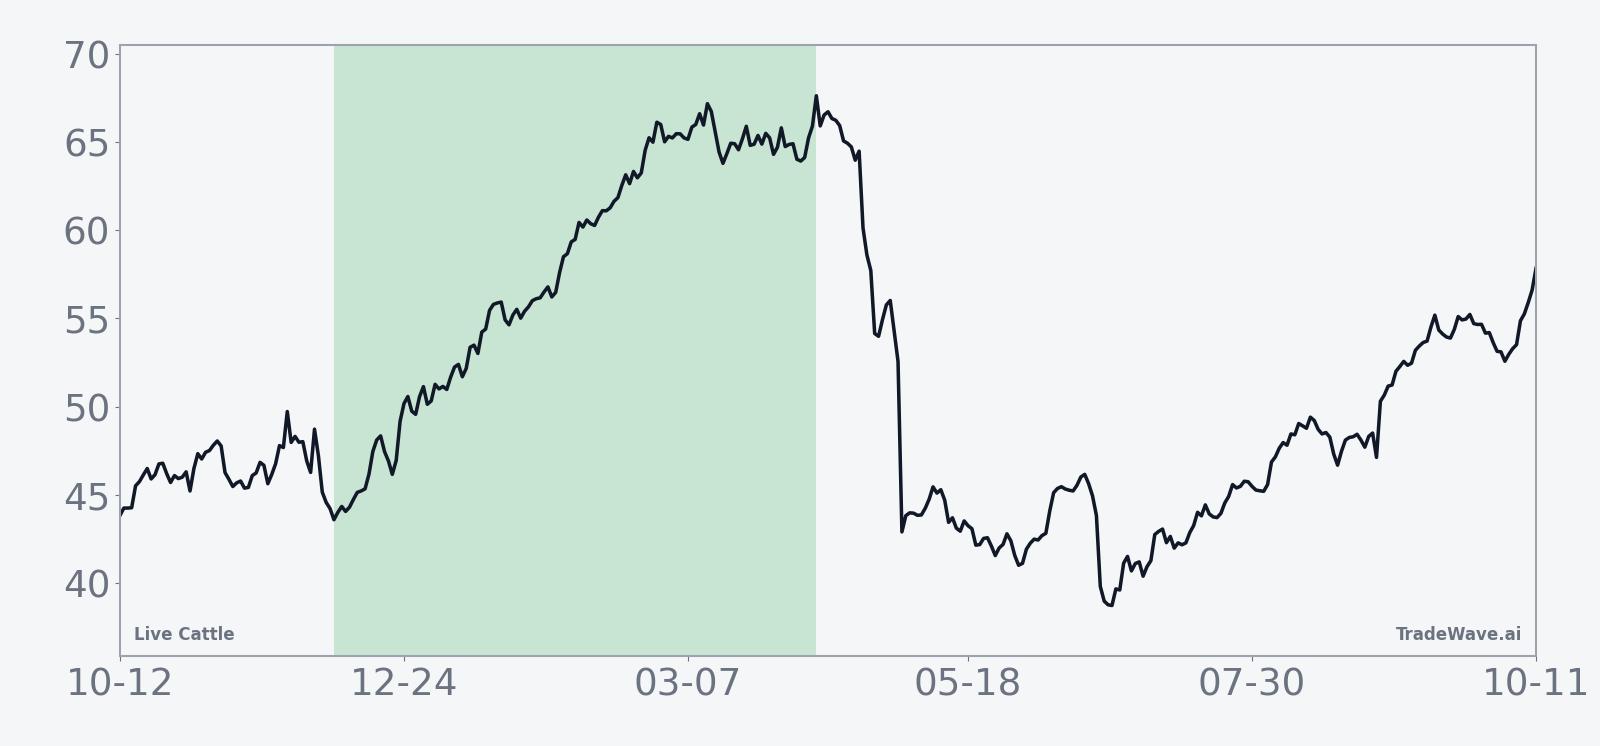
The historical seasonal trend chart for this window, based on the 44-year average, shows a pattern where Live Cattle tends to build gains progressively through the heart of the window rather than delivering all of its performance in a brief burst. The typical path depicts modest early fluctuations followed by a steadier upward drift, consistent with a long bias that becomes increasingly entrenched as the season advances.
Year-by-year net returns, alongside the best and worst intraperiod moves, highlight how upside potential and drawdown risk have coexisted in past windows.
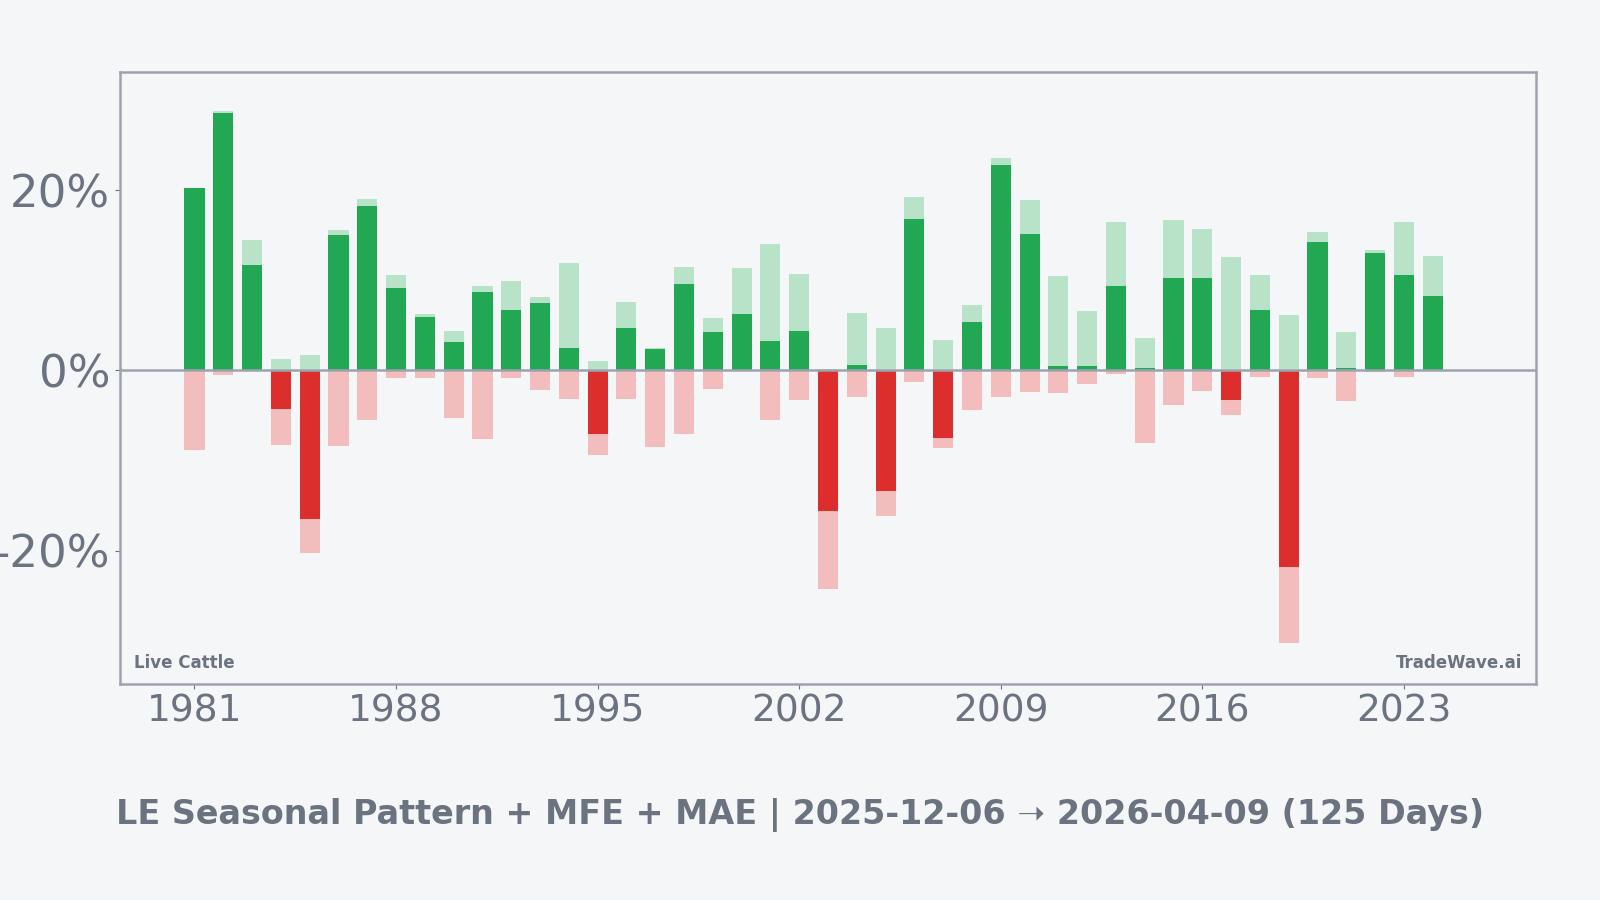
Viewed through that lens, the window has often rewarded patience in years when fundamentals aligned with the pattern, while the weaker episodes have typically involved earlier and deeper maximum adverse excursions before outcomes settled. Taken together, the historical pattern defines the quantitative seasonal backdrop for the current period.
History does not guarantee future results, and adverse excursions (MAE) can be large even in winning windows.
Supply, demand, and fundamentals
Behind the seasonal statistics sit structural supply and demand forces that have shaped Live Cattle pricing in recent years. The U.S. beef cow herd has contracted to some of its smallest levels in decades as ranchers culled animals during prior droughts and high feed cost periods, leaving fewer cattle available for feedlots and packers.[1] The USDA has signaled that it expects this tighter supply backdrop to persist into the medium term, with beef production projected to soften in 2025 relative to the high levels seen earlier in the decade.[2]
On the demand side, U.S. per capita beef consumption has moderated from its historical peaks but remains robust, supported by strong restaurant traffic and steady retail interest in key cuts despite elevated prices.[3] Export markets, particularly in Asia, continue to play a meaningful role for U.S. beef, with currency moves, trade policy, and regional economic conditions all influencing shipment volumes from quarter to quarter.[6]
Feed costs also affect Live Cattle economics, since corn and soybean meal prices determine the profitability of placing cattle on feed. Recent declines in corn prices from their 2022 highs have eased some pressure on feedlots and could encourage heavier placements, though that effect may be tempered by the limited size of the underlying cattle herd.[9] Weather remains another key variable, with pasture conditions and water availability shaping decisions on whether to retain heifers for herd rebuilding or send more animals to market earlier.
Positioning and what to watch
Futures positioning data suggest that speculative traders remain constructive on Live Cattle but are not yet extended, leaving room for sentiment to adjust as new information arrives.[7] Commercial users continue to rely on Live Cattle futures and options to hedge both downside price risk for producers and upside cost risk for packers and retailers, which can influence liquidity and volatility during the upcoming seasonal phase.[8]
Looking ahead, traders will be watching several concrete signposts as the 125-day window beginning on Dec 6 unfolds. First, upcoming USDA Cattle on Feed and cattle inventory reports will be critical for confirming whether herd rebuilding is progressing slowly, which would reinforce the tight-supply narrative that has underpinned recent prices.[1] Second, monthly beef production and cold storage data will offer timely insight into how packers are managing slaughter levels and inventories relative to demand, with any surprise build in stockpiles potentially tempering the historically strong seasonal pattern.[2]
Third, macro indicators including interest rate expectations, real wage growth, and measures of consumer spending will influence how much pricing power retailers and restaurants retain in the beef complex.[5] A sustained easing in long-term Treasury yields and a stable labor market would generally be supportive of higher-priced proteins, whereas a renewed squeeze on household budgets could encourage trading down to cheaper meats.
Finally, traders will monitor how realized volatility in Live Cattle during this window compares with past episodes, particularly around key data releases and weather-driven supply updates. If prices track the historical pattern, incremental strength during the heart of the window, combined with manageable drawdowns relative to prior maximum adverse moves, would be consistent with the long-biased seasonal profile. Conversely, a sharp downside break that resembles the weaker historical years would signal that current fundamentals have diverged meaningfully from the multi-decade seasonal template.
Sources
- USDA - Agricultural Outlook presentations and livestock supply commentary
- USDA - Long-term projections for U.S. livestock and meat production
- USDA ERS - Cattle and beef sector data and statistics
- U.S. Bureau of Labor Statistics - Consumer Price Index data
- Federal Reserve - Monetary policy and interest rate communications
- Financial Times - Commodities coverage and macro commentary
- Reuters - Commodities and futures market news
- CNBC - Commodities market coverage
- Wall Street Journal - Live Cattle futures market data
- CFTC - Commitments of Traders reports
- USDA ERS - Livestock and meat domestic data
- USDA ERS - Corn sector outlook and data
- U.S. EIA - Short-Term Energy Outlook (macro cost environment)
- U.S. Bureau of Labor Statistics - Employment Situation Summary