Gold (COMEX) (GC) heads toward a historically strong seasonal window
Gold (COMEX) is holding near record territory as Fed rate cut bets build, and an upcoming 112 day seasonal window has historically delivered strong but sometimes volatile gains.

Key takeaways
- Gold (COMEX) is approaching a 112 day seasonal window beginning Dec 15, 2025 that has historically favored the long side.
- Across the past 20 years this window has been profitable in 90% of cases, with 18 winning years against only 2 losing years based on end of window results.
- Winning years in this stretch have delivered an average gain of 8.83%, while including all years reduces the average outcome to 7% as the two losing episodes weigh on the distribution.
- The TradeWave Ratio of 1.73 and a Sharpe ratio of 0.85 underline a pattern where price has typically traveled meaningfully higher within the window, albeit with noticeable drawdowns in weaker years.
- Gold futures are trading near $4,237 per ounce, about 3.7% below a recent 52 week high around $4,398, after a year of record breaking gains fueled by aggressive Fed rate cut expectations and heavy central bank and ETF demand.
According to historical data from TradeWave.ai, this upcoming window in Gold (COMEX) has shown a consistent directional tendency across multiple cycles without being tied to any single news event or macro backdrop.
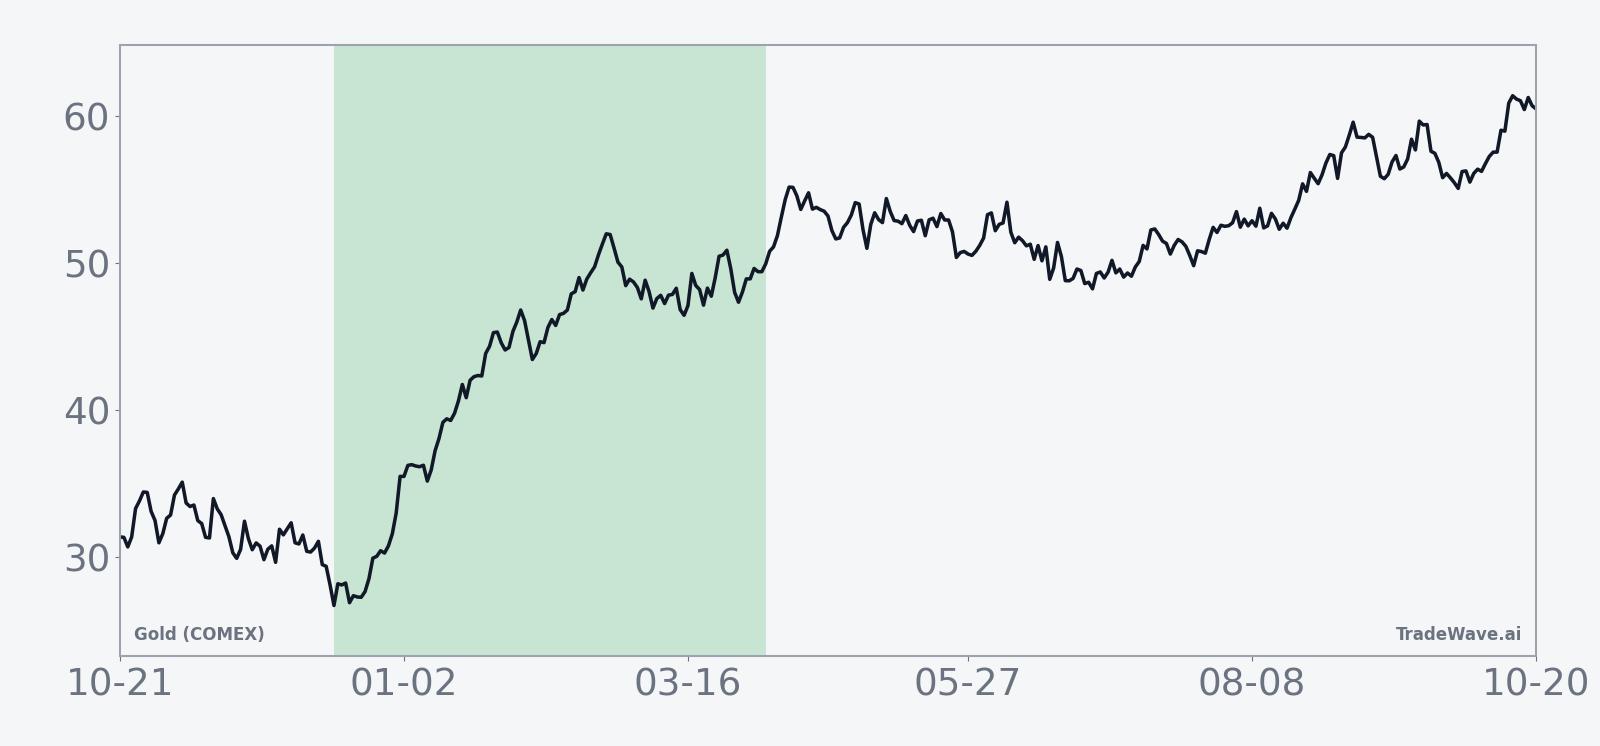
Seasonal window
This seasonal window for Gold (COMEX) begins on Dec 15, 2025 and spans 112 trading days, and over the past 20 years it has historically been a strong stretch for long positions in the contract. With front month COMEX futures recently settling around $4,236.95 per ounce, gold is trading close to record territory and sits about 3.7% below a 52 week high near $4,398 after a powerful rally that has left prices roughly 59% higher year to date.[1][2][3]
Across the lookback, the annualized return for this window is 7.02%, with a cumulative gain of 288% and a median profit of 7.34%, which is consistent with a statistically meaningful upside skew rather than a handful of outliers driving the averages. The 90% hit rate, with 18 winners versus 2 losers, and an average loss of -6.96% in those down years, highlights that the pattern has delivered constructive returns more often than not while still leaving room for occasional sharp setbacks.
TradeWave data show that the typical winning year in this window has gained 8.83%, while including all years, winners and losers together, trims the average outcome to 7% as the negative years pull the mean lower. That profile is reflected in the volatility statistics, with a 7.09% standard deviation and a Sharpe ratio of 0.85 based on end of window results, pointing to a historically favorable risk adjusted payoff for staying aligned with the long trade direction during this stretch.
The intraperiod behavior behind those averages is more dynamic. Maximum favorable excursion, or MFE, captures the best run up from the entry level inside the window, while maximum adverse excursion, or MAE, measures the worst drawdown from entry before the period ends. In strong years such as 2015, gold delivered a 15.57% net gain with an MFE of 20.49% and a shallow MAE of -1.17%, while the weakest year in this sample, 2020, closed the window down -6.76% after an intraperiod rally of 5.81% and a drawdown that reached -9.64%. That mix of sizable MFE and occasional deep MAE underlines that even a bullish seasonal tendency can involve uncomfortable swings along the way.
Year by year bars of net returns, paired with maximum favorable and adverse moves, map how often rallies extended and how deep drawdowns ran inside this window.
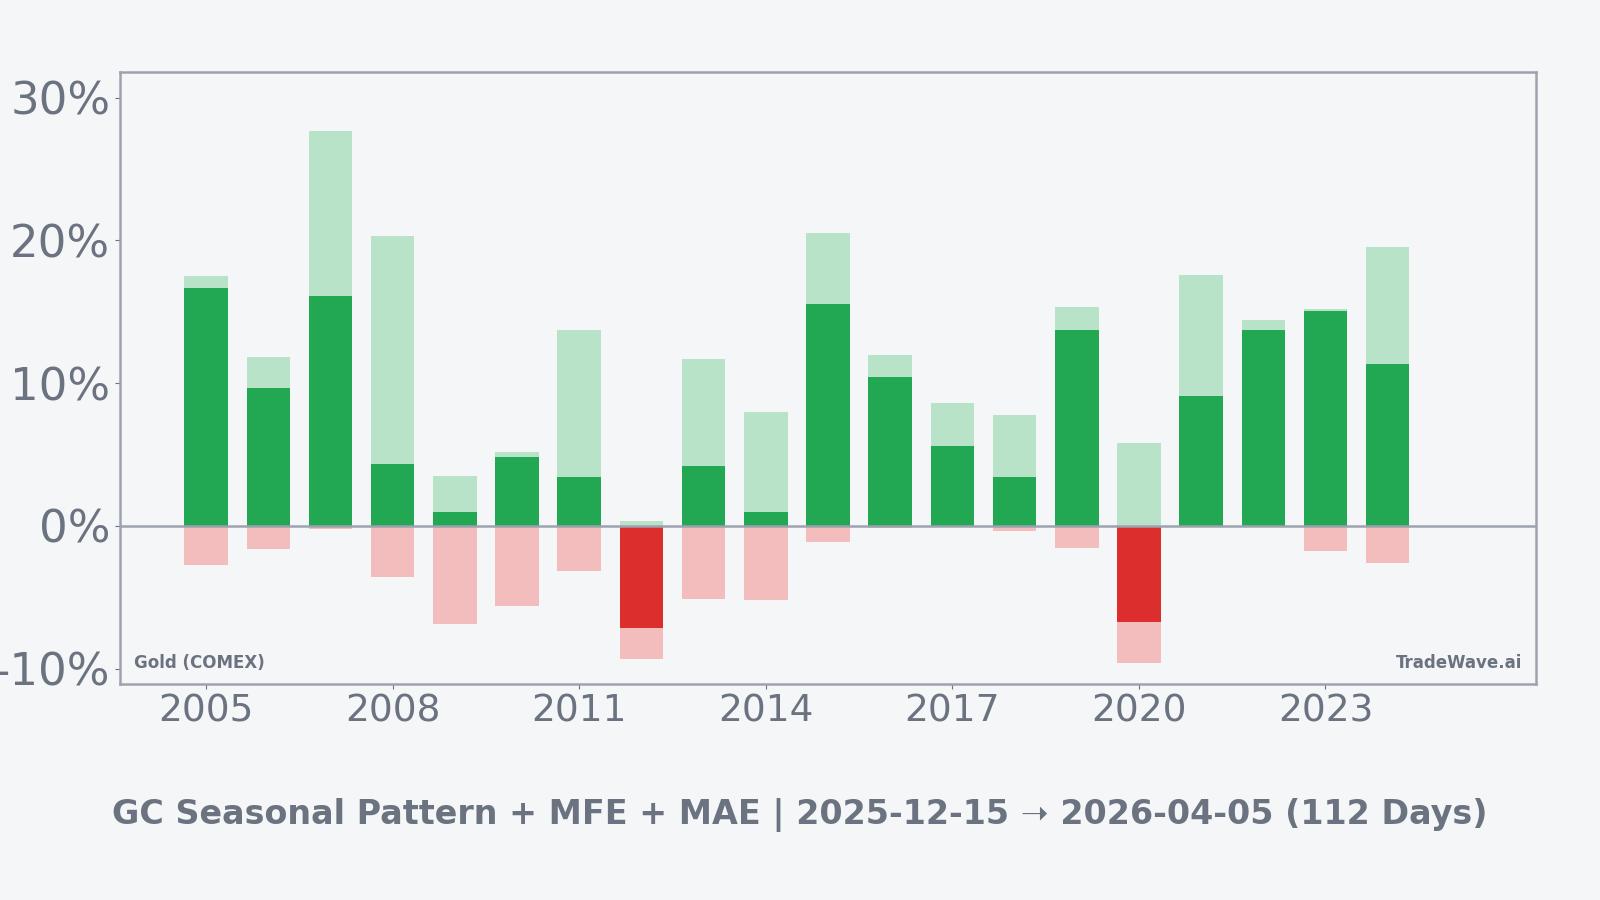
The combined bars of net return, MFE and MAE show that most years in the sample produced double digit maximum favorable excursions, but that intraperiod drawdowns also clustered in the mid to high single digits, especially in the two losing years. Cumulatively, the seasonal pattern has added up to a strong upward bias, yet the distribution reminds traders that even historically favorable regimes can involve sizable dips before the window concludes. Taken together, the historical pattern defines the quantitative seasonal backdrop for the upcoming period.
History does not guarantee future results, and adverse excursions (MAE) can be large even in winning windows.
Price and near-term drivers
In the near term, gold is trading in a tight range just below recent records as markets focus on the Federal Reserve and the dollar rather than the calendar. Spot prices held near $4,205 per ounce on Dec 03 while U.S. gold futures traded around $4,237, with traders watching U.S. employment and inflation data to confirm a widely expected 25 basis point rate cut at the Fed's December meeting.[4]
That follows a brief bout of profit taking on Dec 02, when futures fell more than 1% after touching a six week high at the start of the week, even as rate futures priced in an almost 90% probability that the Fed would ease policy, a backdrop that tends to support non yielding assets such as gold.[5][6]
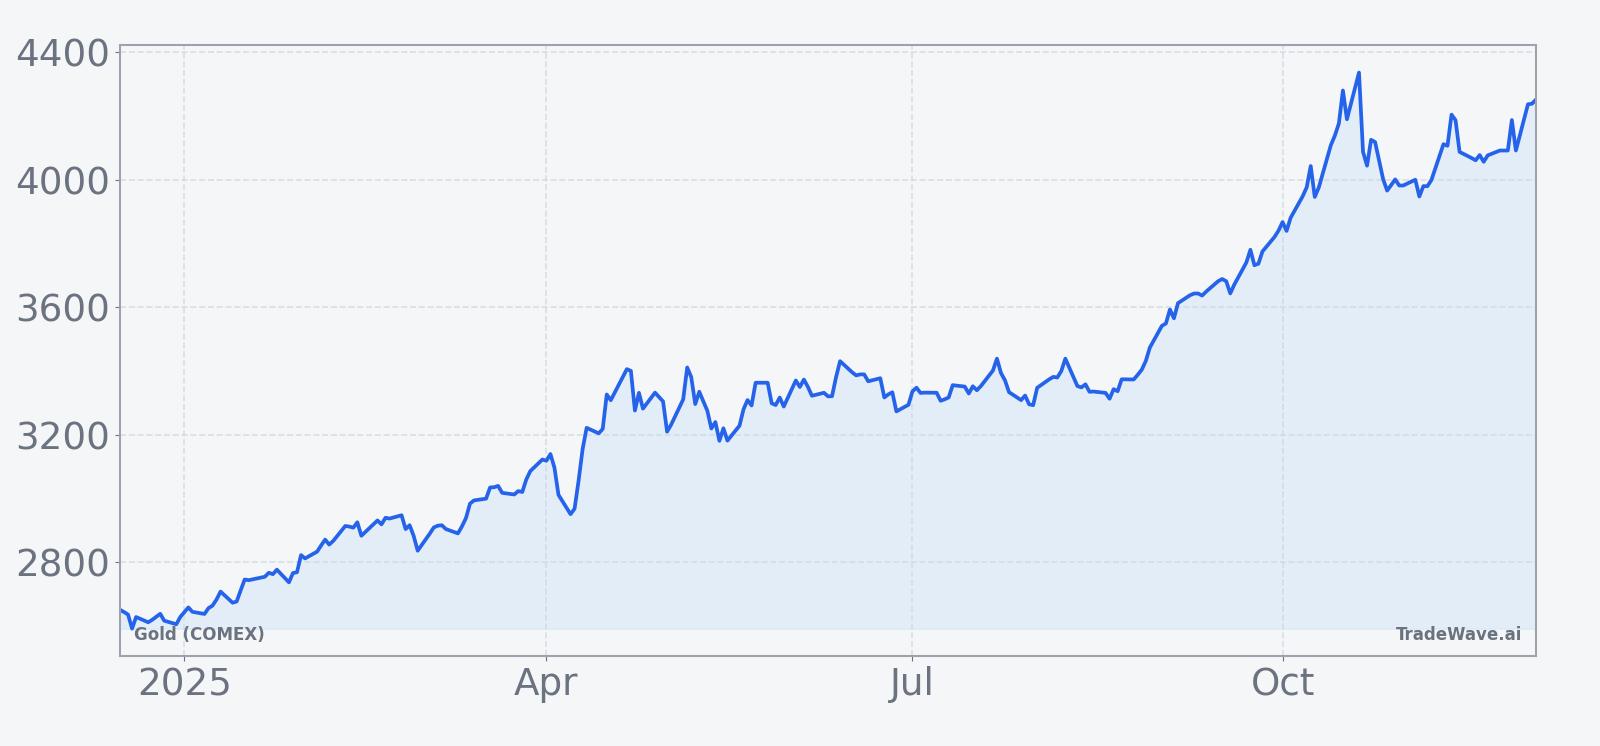
The macro impulse behind gold's run remains clear. After a series of record highs in October driven by safe haven demand, U.S. China trade tensions and a weaker dollar, analysts now see the metal's trajectory as closely tied to the path of U.S. rates and any further deterioration in global growth or geopolitical stability.[6][8]
The chart below situates the latest move in its recent multi month context.
Supply and demand backdrop
Beneath the daily moves, the structural picture for gold remains dominated by investment demand and central bank activity. The World Gold Council's Q3 2025 Gold Demand Trends report highlighted massive ETF buying of about 222 tonnes in the quarter and a fourth straight quarter of bar and coin demand above 300 tonnes, reinforcing the idea that investors, not jewelry buyers, are in the driver's seat of this cycle.[7]
Central banks have also stayed active. After three consecutive years in which official sector purchases topped 1,000 tonnes and lifted total demand to a record 4,974 tonnes in 2024, policymakers in emerging markets have continued to diversify reserves away from the dollar, a trend that has provided a steady undercurrent of support for gold prices in 2025.[8]
Recent commentary from officials, including those in Russia, ties elevated central bank buying partly to concerns about the security of foreign exchange reserves following sanctions and debate over the use of frozen assets, which has encouraged some countries to hold a larger share of their reserves in gold rather than in currencies or sovereign bonds.[8]
Positioning and market structure
On the positioning side, speculative capital remains heavily involved but has shown signs of rotation as prices consolidate near highs. Recent Commitments of Traders data indicate that net long speculative positions in gold futures fell to about 176,600 contracts in late November from around 252,900 contracts earlier in the month, a sizeable reduction that suggests some leveraged traders have taken chips off the table even while the broader trend remains constructive.[9]
Trading activity is still robust. As of Dec 03, COMEX gold futures volume totaled roughly 185,000 contracts for the session with open interest north of 418,000 contracts, underscoring that participation remains deep even as day to day trading ebbs and flows.[10]
Each standard COMEX gold futures contract represents 100 troy ounces of gold, and the contract trades nearly around the clock on CME Group's Globex platform, making it a central reference point for hedgers, miners, refiners and macro funds managing exposure to the metal.[11]
What to watch
The key question heading into the Dec 15 start of the seasonal window is how gold behaves around the current high price zone. A sustained hold above the $4,200 area, with shallow dips and brisk recoveries on soft data or dovish Fed rhetoric, would be consistent with the historical pattern of a strong long sided regime in this part of the calendar, while a break lower that fails to recover quickly would suggest that near term positioning and macro fatigue are overwhelming the seasonal tailwind.
Macro wise, traders will be watching the upcoming Fed meeting, U.S. labor data and the Fed's preferred PCE inflation gauge for confirmation that the central bank is prepared to follow through on rate cuts that would keep real yields contained. Any upside surprise in inflation or a pushback against aggressive easing could cool gold's momentum even if the longer term seasonal statistics remain favorable.
On the fundamentals side, flows into physically backed ETFs and reported central bank purchases will serve as a real time check on whether the investment community continues to add exposure at these elevated levels. Strong or accelerating ETF inflows and sustained official sector buying would reinforce the pattern's bullish bias, whereas a visible slowdown could leave prices more vulnerable to the kind of deeper drawdowns that show up in the MAE profile of past losing years.
Positioning bears watching as well. If speculative net longs begin to rebuild from recently reduced levels while prices hold above recent support, it would suggest that traders are leaning back into the trade ahead of a historically constructive stretch. Conversely, a continued reduction in net length or a rise in gross shorts at the same time as price starts to slip could signal that the market is setting up for a more choppy or corrective version of the seasonal window.
For now, the combination of a powerful macro narrative centered on lower real yields and a long history of favorable outcomes in this specific 112 day window gives market participants a clear quantitative backdrop. The way gold trades as it approaches and moves through that window will show whether this cycle continues to rhyme with the past or carves out a different path against a very different macro environment.
Sources
- Investing.com - Gold Futures Historical Prices
- Barchart - Gold Dec '25 (GCZ25) Futures Overview
- TradingEconomics - Gold Price, Chart, Historical Data and News
- Reuters - Gold holds steady ahead of US data, rate cut bets in focus
- Reuters - Gold falls on profit booking, investors eye Fed rate cut signals
- Reuters - Gold touches six-week high as rate cut bets weigh on dollar
- World Gold Council - Gold Demand Trends Q3 2025
- World Gold Council - Gold Demand Trends and Full Year 2024 Report
- Investing.com - CFTC Gold Speculative Net Positions
- Associated Press - Gold Futures Market Summary
- CME Group - Gold Futures Overview