Crude Oil (CL) heads toward a historically strong year-after-election seasonal window
Crude Oil is trading near $59 a barrel as the market digests OPEC+ supply decisions, U.S. inventory data and a historically strong late December window that has often set the tone for the new year.

Key takeaways
- This seasonal window for Crude Oil begins on Dec 20 and spans 18 trading days in the year after the presidential election, a period that has historically tilted bullish for prices.
- Across the available history for this election-cycle phase, the pattern has been profitable in 80% of years, with 8 winners and 2 losers for a long bias.
- Winning years in this window have seen average gains of 8.98%, while including all years reduces the all-in average to 6%, reflecting the impact of a small number of losing episodes.
- The TradeWave Ratio of 1.63 and a Sharpe ratio of 0.71 point to meaningful historical travel in the trade direction within the window, with risk-adjusted returns that are positive but not extreme.
- Per-year data show that strong years such as 2009 and 2021 delivered double digit net advances, while weak years like 1997 and 2013 involved sharper drawdowns that long positions would have had to tolerate.
According to historical data from TradeWave.ai, this late December stretch in the year after the presidential election has repeatedly stood out from typical winter trading ranges in Crude Oil. The next section uses that long term seasonal database to frame the upcoming window in quantitative context, separate from any single news headline.
Seasonal window
Crude Oil is set to enter a historically strong late December seasonal window on Dec 20 that lasts 18 trading days and is defined specifically for years after U.S. presidential elections. Today the front month WTI contract is trading around $59 a barrel, up modestly on the session but still roughly 14% lower than a year ago after a choppy year for energy markets.[1] That combination of subdued spot prices and a historically constructive short window gives traders a clear seasonal backdrop to weigh against current macro and supply signals.
Because this pattern groups only years that followed presidential elections, it samples episodes when fiscal plans, regulatory priorities and expectations for monetary policy were resetting, rather than mixing them with mid cycle environments. Pattern phase is the year after the presidential election, while the calendar phase is also the year after the presidential election, late in the year, with this specific window running across the transition from December into early January.
The trade direction for this window is long, so positive returns represent years in which crude rallied during the period, while negative outcomes mark episodes in which a long bias would have struggled. Over the full sample, 8 of 10 years were profitable for the pattern, leaving only 2 losing instances and a Percent Profitable reading of 80% that sits well above a simple coin flip. Average profit in winning years is 8.98%, while averaging across every year, including losers, produces an all years gain of 6%, consistent with a Cumulative Return of 71% for the strategy across the lookback.
Risk and reward profiles inside the window are captured by the maximum favorable excursion and maximum adverse excursion data, often abbreviated as MFE and MAE and defined as the best and worst intraperiod excursions from the entry, or the peak run up and worst drawdown within the window. In standout years such as 2009 and 2021, net gains of 14.78% and 14.97% were paired with favorable excursions above 15%, while adverse moves during those episodes remained contained near or below 1%. In contrast, 1997 and 2013 saw net declines of 7.7% and 5.93% and adverse excursions of 8.46% and 6.16%, illustrating that even in a generally bullish pattern, occasional sharp downside swings have occurred.
The TradeWave Ratio (TWR) for this setup is 1.63, which reflects how far price typically travels in the trade direction within the window, independent of the final close, while a Sharpe ratio of 0.71 summarizes the end of window outcomes on a risk adjusted basis. Together, those measures indicate a pattern that has historically produced meaningful directional movement with volatility that is noticeable but not out of line with broader crude trading conditions in the same periods.
The election-cycle framing matters because this window sits at the end of the year after the presidential election and just ahead of the midterm election year, a transition that has often seen shifts in expectations for fiscal policy, regulation and global growth. Grouping only years with that combination of political and macro conditions helps isolate how crude has tended to behave as markets look ahead to the next phase of the policy calendar rather than treating every December the same.
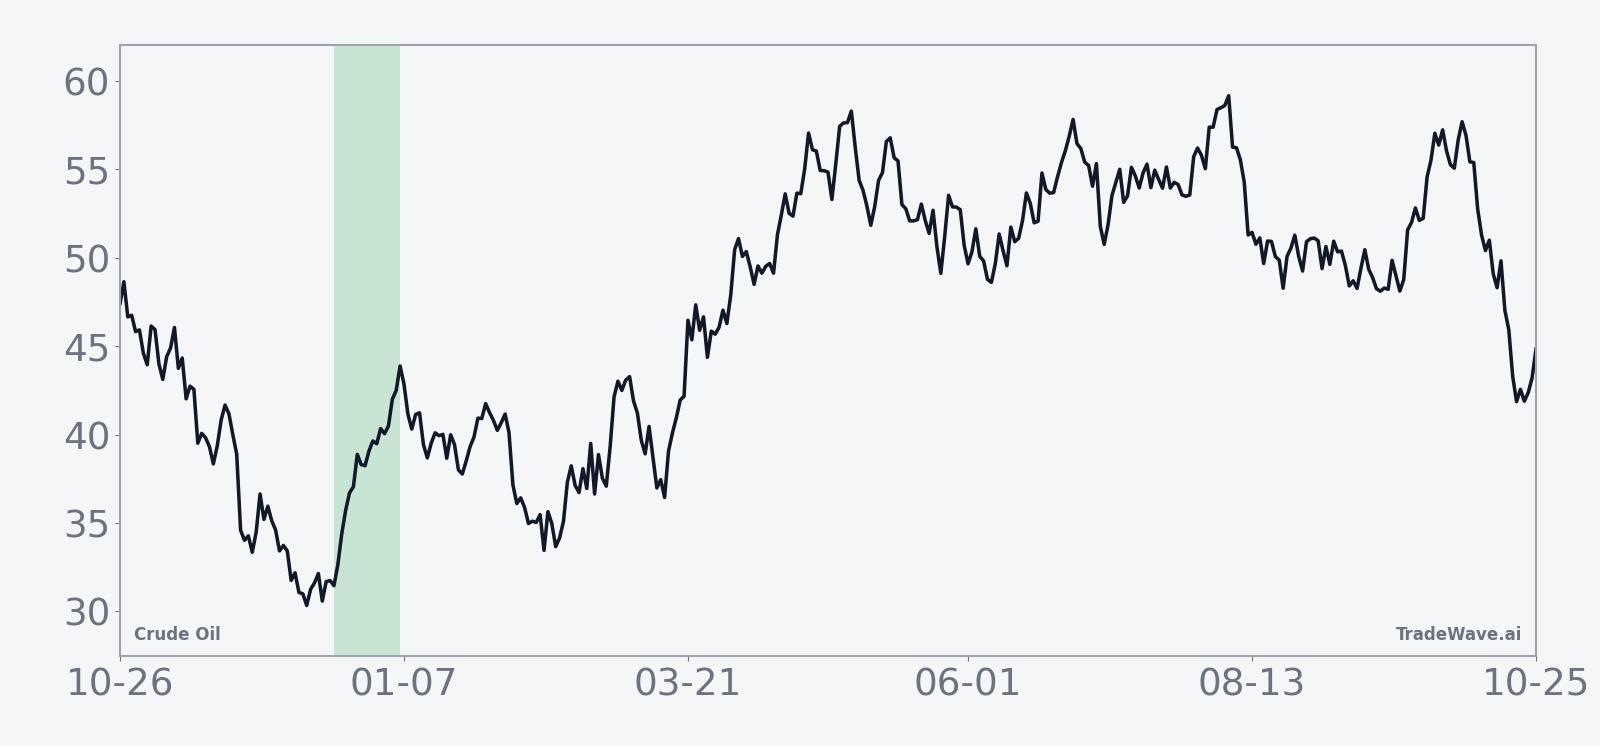
The historical seasonal average shows gains that tend to build relatively steadily across the 18 day span, with only modest early setbacks before the average path drifts higher into the back half of the window. That shape suggests that in many years, buyers have been willing to add exposure gradually as the period progresses rather than front loading the move into the opening days.
Year by year bars with embedded peak and drawdown moves highlight upside persistence alongside episodes of notable intraperiod stress.
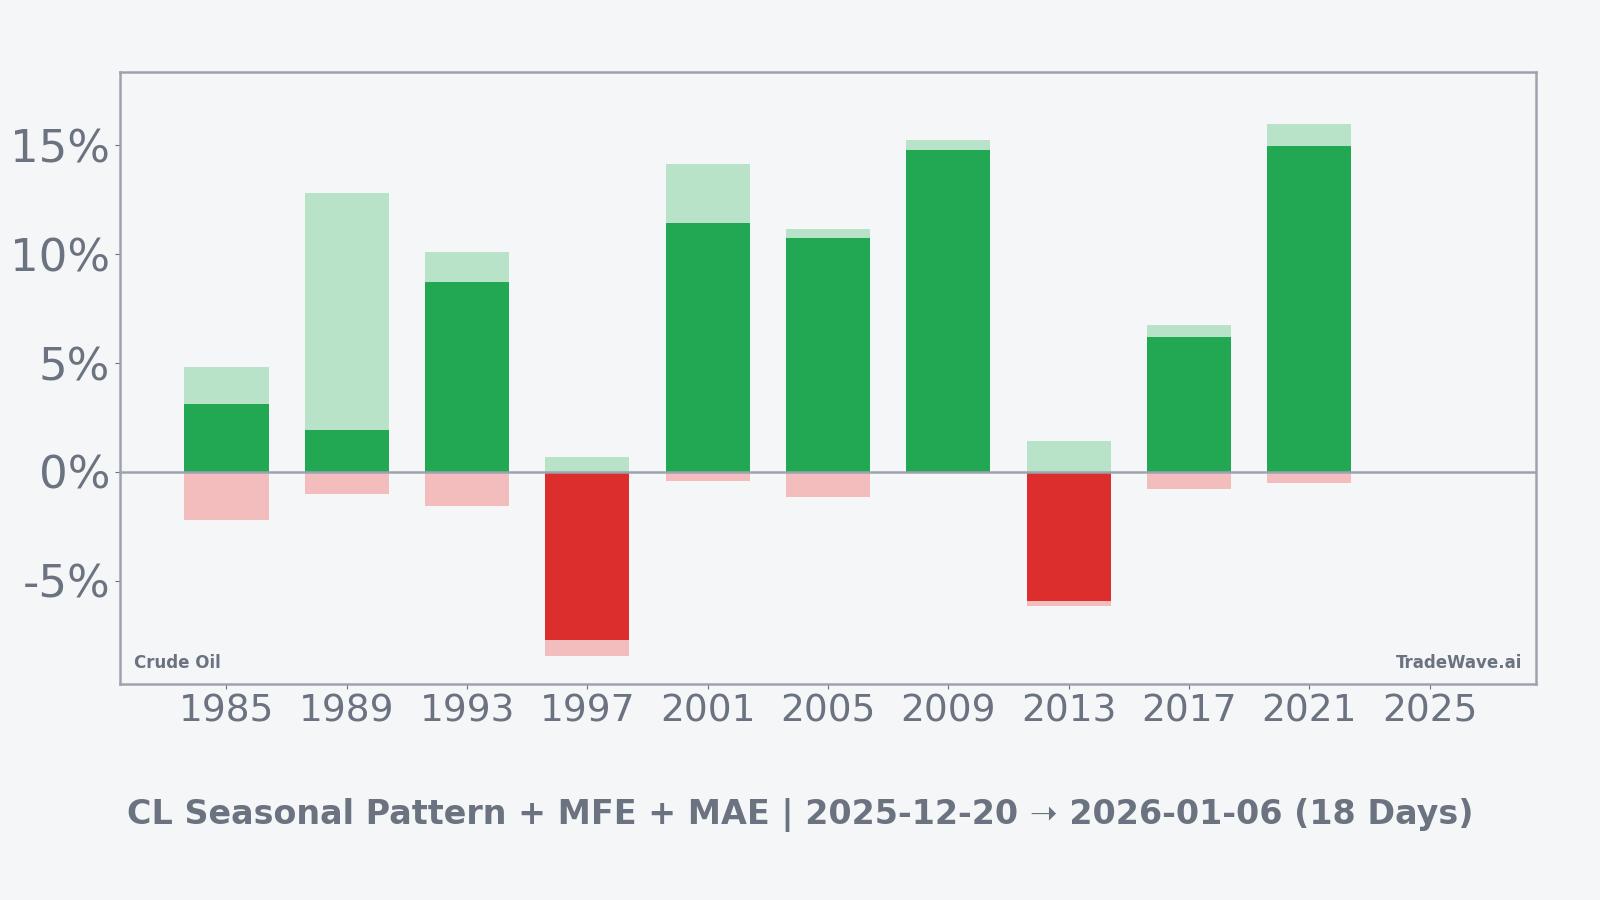
Viewed through the combined net, MFE and MAE bars, the pattern looks like a classic high variance bullish setup: many years with strong positive net returns and large favorable excursions, but a few instances where adverse moves were deep enough that long positions would have been uncomfortable even if the broader cycle remained supportive. Taken together, the historical pattern defines the quantitative seasonal backdrop for the current period.
History does not guarantee future results; adverse excursions (MAE) can be large even in winning windows.
Price and near-term drivers
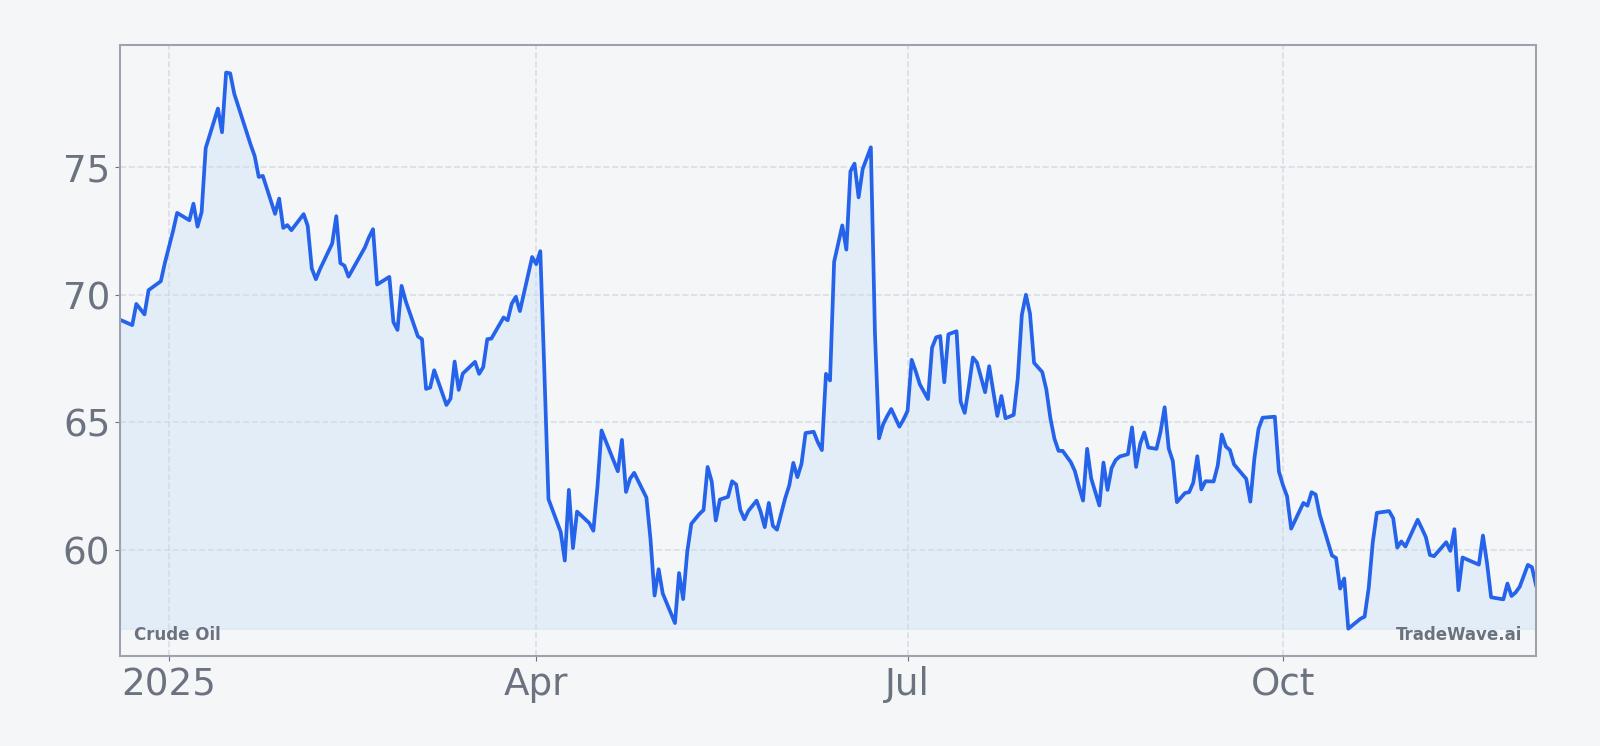
Front month WTI futures settled near $59 a barrel on Dec 3, leaving crude modestly higher on the day but still down about 2.4% over the past month and nearly 13.8% over the past year as the contract has traded in a relatively tight band around the high 50s.[1][2][3] Recent sessions have been characterized by rangebound action as traders balance concerns over oversupply with signs of firm refined product demand and shifting expectations for global growth.[4][5]
The chart below situates the latest move in the context of the past twelve months of trading.
On the supply side, OPEC and its allies recently chose to keep existing production targets in place for the first quarter of 2026 while also approving a new mechanism to reassess member capacity baselines, moves that signal a preference for stability as the group navigates a soft patch in prices.[6][7][8] At the same time, U.S. commercial crude inventories outside the Strategic Petroleum Reserve stood at about 426.9 million barrels in late November, roughly 4% below the five year seasonal average, underscoring that concerns about oversupply sit alongside relatively tight stocks compared with recent history.[9][10]
Macro and policy backdrop
The crude market is also trading against a shifting monetary policy backdrop in the United States, where the Federal Reserve has signaled that uncertainty around the outlook remains elevated even after inflation pressures cooled from their peak.[11] Market based probabilities now point to a high likelihood of at least one additional rate cut by the end of the year and further reductions in 2026, a path that would gradually ease financial conditions relative to the starting point of this cycle.[12][13]
For oil, a slower and shallower rate path can matter through several channels, including its influence on global growth expectations, the U.S. dollar and risk appetite for commodities. If easier policy supports a more constructive growth trajectory than investors feared earlier this year, demand side support for crude could intersect with the historically bullish window identified in the election-cycle data, although that relationship is far from mechanical.
Physical data from the U.S. energy system provide a mixed but steady picture heading into the seasonal window. The latest Weekly Petroleum Status Report shows refinery runs averaging 16.9 million barrels a day and utilization above 94%, while overall gasoline and distillate production also increased in the most recent week.[10] Inventory statistics show that crude stocks excluding the SPR remain modestly below their rolling five year average despite recent week over week builds, a configuration that helps limit the downside from oversupply if demand holds up into the new year.[9]
What to watch in this window
The upcoming 18 day window beginning on Dec 20 sits at the end of the year after the presidential election and immediately ahead of the midterm election year, so it will be watched closely for how crude trades around key psychological and technical levels. Traders will focus on whether WTI can hold the high 50s and potentially retest the low 60s, or whether renewed selling pressure pulls prices back toward the mid 50s despite a historically supportive seasonal pattern.[1]
Weekly inventory data from the U.S. Energy Information Administration, including crude, gasoline and distillate stocks, will remain central in shaping the market narrative, particularly if draws or builds diverge significantly from recent trends relative to the five year average.[9][10] Stronger than expected draws during the window would align with the historical tendency for prices to firm, while persistent builds would represent a clear test of the pattern.
OPEC and OPEC plus communications will also matter, even with formal production policy now set for the first quarter of 2026, since any signs of slippage in compliance or hints about how baselines might be reset later in the decade could influence sentiment around medium term supply.[6][7][8] Finally, incoming data and commentary that shift expectations for the Fed rate path or broader global growth outlook will feed back into crude through the demand channel, giving the market several macro signposts to track as this historically strong seasonal window approaches its start.[11][12][13]
Sources
- TradingEconomics - Crude Oil Price, Chart, Historical Data and News
- MarketWatch - Crude Oil WTI (NYM $/bbl) Front Month Overview
- Federal Reserve Bank of St. Louis - Crude Oil Prices: West Texas Intermediate (WTI)
- Wall Street Journal - Crude Futures Settle Lower in Rangebound Trade
- Bloomberg - Oil Steadies as Narrowing Spreads Point to Softer Conditions
- OPEC - Press Release on Production Levels and Seasonality
- Argus Media - OPEC+ Agrees Mechanism to Set New Production Baselines
- Energy Industry Review - Oil Production Growth for Q1 2026 Blocked by OPEC+
- Rigzone - USA Crude Oil Inventories Rise Almost 3MM Barrels WoW
- U.S. Energy Information Administration - Weekly Petroleum Status Report Summary
- Federal Reserve - FOMC Statement, October 29, 2025
- Morningstar - A December US Fed Interest Rate Cut Looks Likely Again
- J.P. Morgan Research - What Is the Fed’s Next Move?