Crude Oil (CL) set to enter a historically strong seasonal window into 2026
Crude Oil futures are consolidating around $59 a barrel as OPEC+ keeps output steady and U.S. inventories edge higher, just ahead of a multi month seasonal window that has historically delivered strong but volatile gains.

Key takeaways
- Crude Oil is approaching a 123 day seasonal window starting on Dec 20 that has historically been a strong stretch for prices, based on a 41 year history.
- The long pattern has been profitable in 76% of years, with 31 winners and 10 losers, and winning years have averaged a 19.69% gain, while including all years brings the average to 10%.
- Historical excursions show sizeable swings, with some years recording very large drawdowns even when the window eventually finished higher.
- Recent EIA data show U.S. crude inventories drifting modestly higher and refinery runs elevated, while stocks remain slightly below their five year average. [7][8][9]
- Speculative net long positions in crude futures have been cut back sharply in recent weeks, suggesting less crowded positioning heading into the new window. [11][12]
According to historical data from TradeWave.ai, this upcoming window for Crude Oil has shown a consistent directional bias over multiple decades, providing a quantitative backdrop for how the contract has tended to behave through late winter and early spring.
Seasonal window
This seasonal window begins on 2025-12-20 and spans 123 days, a stretch that has historically been a strong period for Crude Oil. Today, front month West Texas Intermediate futures for January delivery settled at about $58.95 a barrel on the New York Mercantile Exchange, keeping prices locked in a tight high $50s range that has dominated recent sessions. [1][2]
In this long biased pattern, the historical profile shows more winning years than losing ones, with the window finishing higher in 76% of observations across 41 years, corresponding to 31 winners and 10 losers. Winning years have posted an average gain of 19.69%, while averaging all years, including drawdowns, reduces the outcome to 10%, a reminder that losses in the weaker years can be sizable even inside a generally constructive regime. The cumulative return across the full sample is 729%, and the Sharpe ratio of 0.33 indicates that while the window has historically rewarded risk, the variability of outcomes has been meaningful rather than smooth.
The strongest recent example in the sample is 2021, when Crude Oil rallied 50.07% within the window, with a maximum favorable move of 84.26% from entry and only a shallow worst drawdown of 0.5%. At the other extreme, 2019 delivered an 80.8% loss over the same calendar stretch, with a maximum adverse excursion of 89.21%, illustrating how severe the downside can be in outlier years even when the broader pattern is positive. These two cases frame the range of historical outcomes, from powerful trending advances to very sharp collapses in periods when macro conditions overwhelm the usual seasonal backdrop.
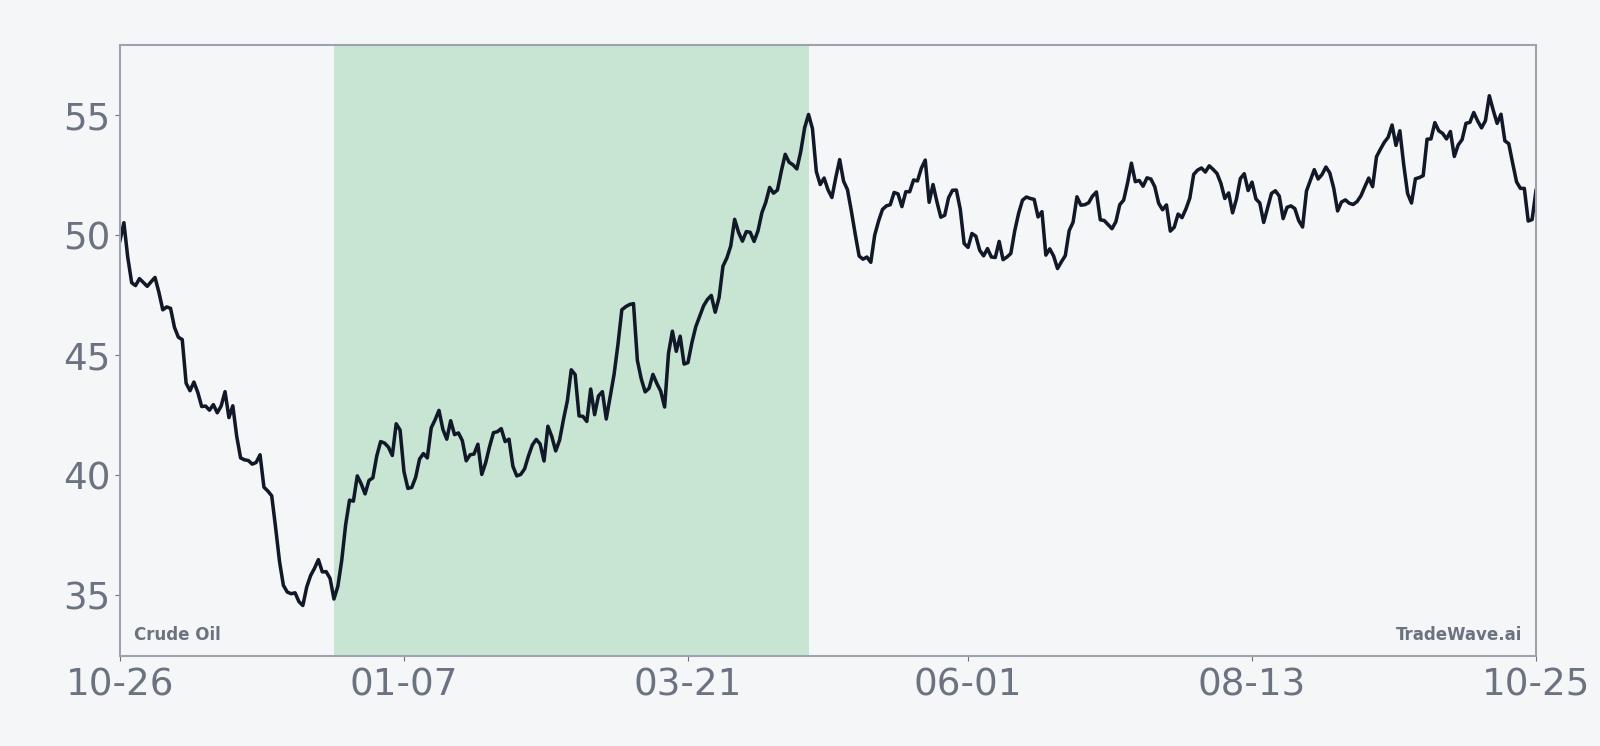
The historical trend chart for this window, based on the 41 year average path, shows gains tending to build in stages rather than in a straight line. The pattern often features a firmer tone early in the window, followed by periods of consolidation and occasional mid window setbacks before strength rebuilds toward the latter third of the period. That staged ascent aligns with the idea that winter demand, refinery maintenance schedules, and macro news flow tend to inject bursts of volatility around an underlying positive bias.
Year by year net returns and intraperiod swings highlight how often upside runs have come alongside meaningful drawdowns.
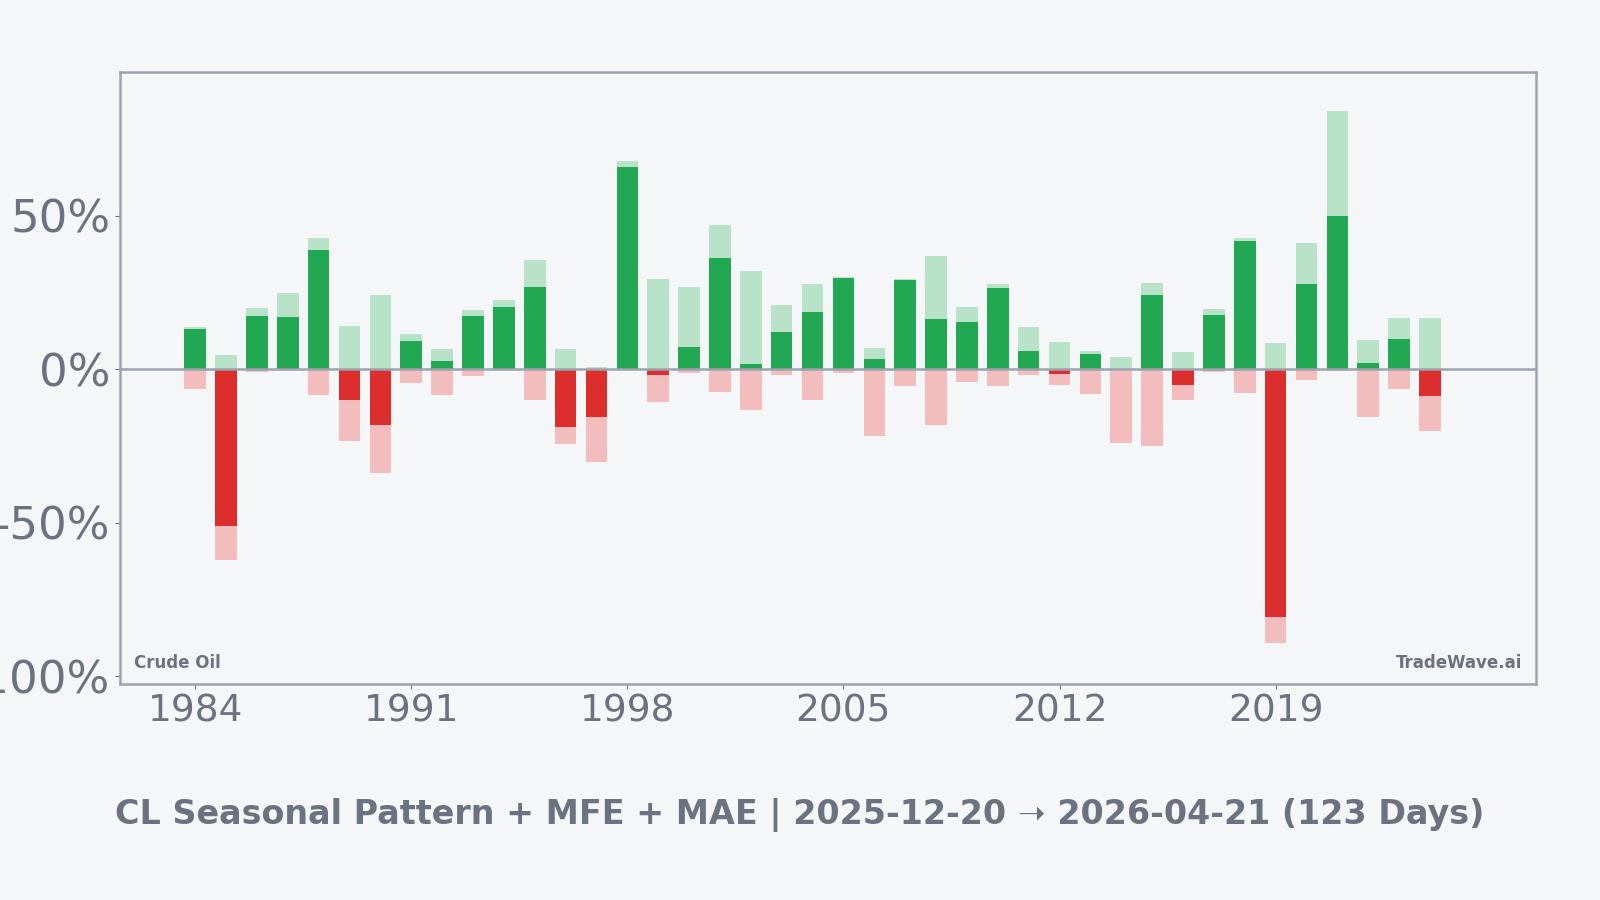
The combined net, maximum favorable excursion and maximum adverse excursion view shows that even many winning years experienced sizeable interim selloffs before finishing higher. Large positive MFE readings alongside deep MAE readings in some years point to a high variance environment where rallies and sharp pullbacks have both been common features of the window. Historically, that has meant that the window has offered notable upside potential in many years, but only at the price of tolerating material swings along the way.
History does not guarantee future results, and the adverse excursions (MAE) recorded in past years show that even a historically strong seasonal window for Crude Oil can involve large interim drawdowns.
Price and near-term drivers
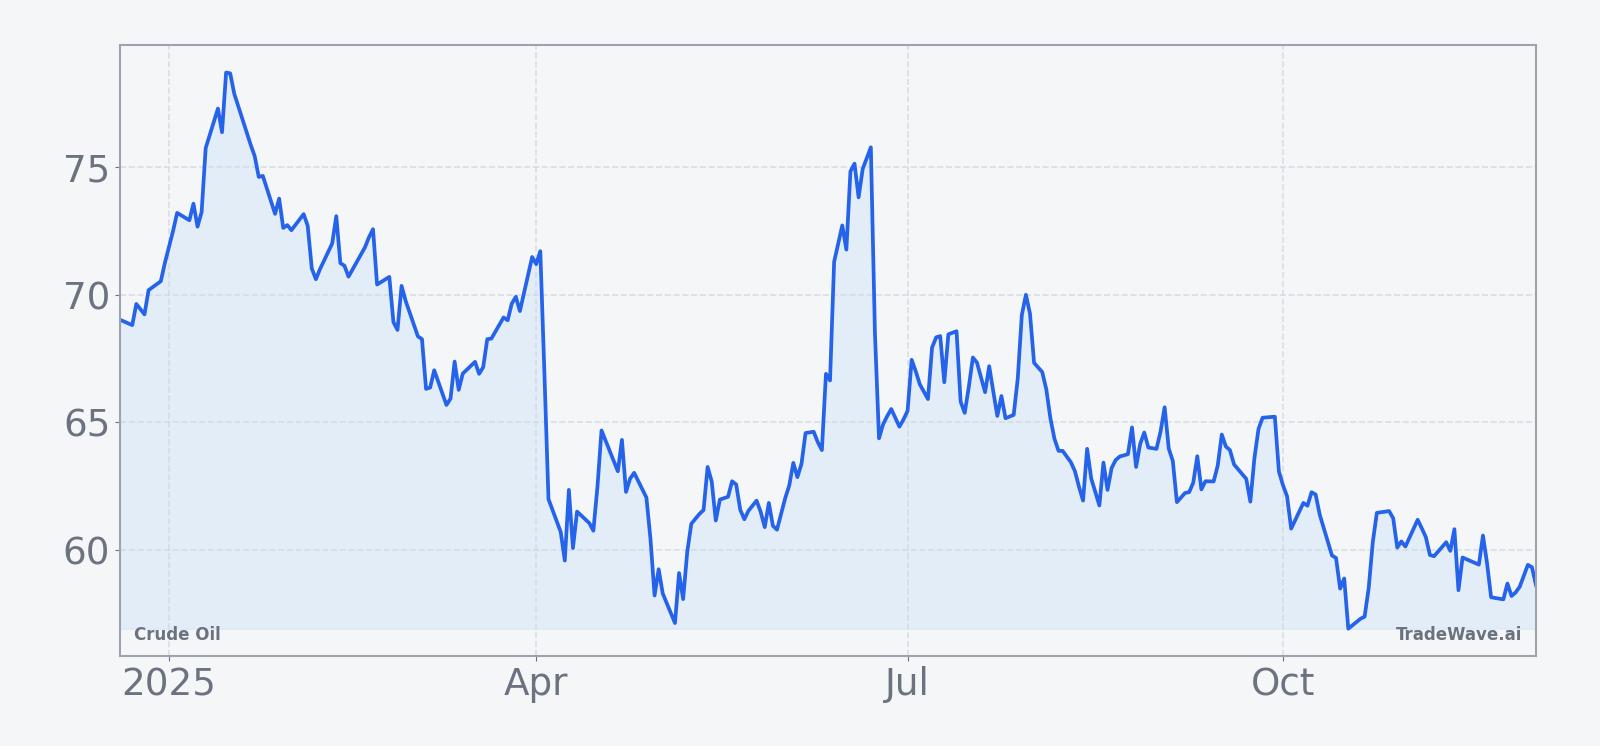
Crude Oil futures added modestly on Dec 3, with front month WTI settling at $58.95 a barrel, up 0.53%, keeping prices pinned near the $59 level that has defined trading in recent sessions. [1][2][10] The move builds on gains that followed last weekend’s OPEC+ meeting, where producers opted to maintain current output levels into the first quarter of 2026, a decision that helped WTI recover into the high $50s but leaves prices well below levels seen earlier in the year. [3][4] Analysts still see 2025 on track to be one of the weakest years for oil since the pandemic period, pointing to the pace at which previously curtailed OPEC+ barrels were reintroduced to the market as a key driver of the broader decline. [5]
Macro conditions have added to the push and pull. A softer U.S. dollar and shifting expectations for Federal Reserve policy have supported commodities at the margin, while the latest U.S. energy outlook raised projected crude output for 2025 to 13.59 million barrels per day, reinforcing the view that supply from shale producers remains robust. [6] At the same time, geopolitical risk remains elevated, with renewed headlines around the war in Ukraine and sanctions on Russian exports helping to keep a floor under prices even as demand concerns linger. [14]
The chart below situates the latest move in its recent multi month context.
Supply and demand backdrop
Fresh data from the U.S. Energy Information Administration show crude inventories rising slightly into the end of November. Crude stocks increased by about 574,000 barrels in the week to Nov 28, taking commercial inventories to roughly 427.5 million barrels, which is about 3% below the five year seasonal average. [7][8][9] Refinery runs remain elevated, with inputs averaging 16.9 million barrels per day and utilization above 94%, a sign that product demand and export flows are still solid even as headline crude prices sag. [7]
The global balance remains finely poised. OPEC+ has chosen to hold output steady into the first quarter of 2026, effectively slowing the pace at which earlier production cuts are unwound and signaling a preference for preventing another pronounced price slide. [3][4] Non OPEC supply, led by U.S. producers, continues to climb, while demand growth has been uneven across regions as manufacturing surveys and freight metrics point to a patchy macro backdrop. [6] The net effect has been a market that is neither in a clear shortage nor in a deep glut, which helps explain why prices have gravitated toward a relatively narrow band around current levels.
Positioning and flows
Speculative positioning in crude futures has shifted notably in recent weeks. The latest data on crude oil speculative net positions show net longs around 39,800 contracts, sharply lower than the previous reading near 74,300, indicating that managed money has scaled back some of its bullish exposure despite the recent price stabilization. [11] The Commodity Futures Trading Commission is in the process of catching up on Commitments of Traders reports after a data publication interruption earlier in the autumn, but the direction of travel has been toward a less crowded long side. [12]
At the same time, commercial hedging activity remains active in the benchmark CL contract on NYMEX, which serves as a central reference price for producers, refiners and financial traders worldwide. [13] That combination of lighter speculative length and steady commercial use means the upcoming seasonal window is likely to be navigated in a market that is engaged but not heavily skewed to one side of the boat, at least based on the latest positioning snapshots.
What to watch
The seasonal window starting on Dec 20 has historically been a constructive period for Crude Oil, with a long biased pattern, a high share of winning years and sizeable average gains, but also a history of large intraperiod swings. As that window approaches, traders will be watching whether prices can hold the current high $50s to low $60s range or break decisively higher or lower, and how that behavior lines up with the typical pattern of staged strength seen in the historical trend. The cumulative seasonal profile suggests that strength often builds over weeks rather than days, so the manner in which rallies or pullbacks develop through early 2026 will matter as much as any single session move.
On the fundamental side, weekly EIA reports on inventories, refinery runs and product stocks will remain central indicators of whether the market is tightening or loosening relative to the five year average. [7][8][9] OPEC+ compliance with its current output stance, and any signals about adjustments to 2026 production targets, will also be important, particularly if demand data surprise on the upside or downside. [3][4] Finally, traders will monitor updates to speculative net positions from the CFTC for signs that money managers are rebuilding length into the seasonal window or staying cautious, since renewed crowding on one side of the market can amplify the kind of large favorable and adverse excursions seen in past years. [11][12]
Taken together, the interplay between a historically strong seasonal backdrop, a delicate supply demand balance and evolving positioning will define how influential this upcoming 123 day window proves to be for Crude Oil as the market transitions into 2026.
Sources
- Xinhua - Crude futures settle higher
- TradingEconomics - Crude Oil price, chart and news
- Reuters - Oil climbs over $1 a barrel on OPEC action, Ukraine attack
- EBC - Oil Prices Rebound as OPEC+ Extends Supply Discipline into 2026
- Morningstar / MarketWatch - Why oil is on track to post its largest yearly decline since the pandemic
- Yahoo Finance - Crude rises on dollar weakness and geopolitical risks
- U.S. EIA - Weekly Petroleum Status Report highlights
- Oilandgas360 - U.S. crude oil inventories increase by 0.6 million barrels
- EnergyNow - US crude, gasoline stocks rise, distillate inventories fall, EIA says
- Investing.com - Crude Oil WTI futures historical data
- Investing.com - CFTC Crude Oil speculative net positions
- CFTC - Commitments of Traders reports overview and schedule
- CME Group - WTI Light Sweet Crude Oil futures overview
- DTN - WTI at $58 as Putin raises tensions, ULSD tumbles