S&P 500 (SPX) enters a historically strong year after the presidential election seasonal window
S&P 500 is starting a 136-day year-after-election seasonal window near record highs, just as investors lean into Fed rate cut hopes and a cooling inflation backdrop.
Key takeaways
- S&P 500 begins a 136-trading-day seasonal window today in the late part of the year after the presidential election, a regime that has historically leaned positive but with meaningful volatility across cycles.
- The Trade Direction for this pattern is long, with 62% of historical windows finishing higher across 15 winning years and 9 losing years in the sample.
- Average gains in the winning years have been 7.55%, while the all-years average including losers is 2%, underscoring the gap between strong rallies and softer outcomes in weaker cycles.
- Maximum favorable excursions in past years have been sizable, but maximum adverse excursions show that sharp drawdowns have also occurred inside the window even when the final result was positive.
- This window unfolds as the index trades close to record highs and the Federal Reserve prepares its December policy meeting, which could shape how the next leg of this seasonal phase is priced.
According to historical data from TradeWave.ai, this stretch of the year after the presidential election has shown a distinct return pattern for the S&P 500 across multiple cycles, providing a quantitative backdrop to the current rally without implying any specific outcome this time.
Seasonal window
This seasonal window begins on 2025-12-03 and spans 136 trading days. Historically, during this period, S&P 500 has shown a modestly strong but sometimes choppy tendency in the long direction, with gains outweighing losses across the sample.
The index closed today at 6,849.72, up 0.3% on the day and hovering close to record territory after another advance in large caps.[1]
At roughly 16.5% higher for 2025 on a price basis and trading about 1.0% below its 52-week high of 6,920.34, S&P 500 is entering this window from an extended starting point rather than from a depressed base.[2][3]
The S&P 500 is widely regarded as the primary gauge of large-cap United States equities, covering roughly 80% of available market capitalization, so any seasonal tendency in the index typically carries through to portfolios and benchmarks built around it.[4]
This window also sits in the final stretch of the year after the presidential election, a phase that has often looked like a digestion period for markets following the election year surge, with returns that can be positive but less uniformly strong than in the year before the next election.[5][6] Grouping historical data by this four-year cycle phase rather than by simple calendar years helps isolate how policy shifts, early administration agendas and changing expectations around the next midterm year tend to cluster in specific parts of the cycle.
Within this long-only framework, the pattern has historically posted 62% profitable windows, with 15 winning years against 9 losing years. The average gain in winning windows has been 7.55%, while the all-years average including losing windows is 2%, which reflects both the strength of the best cycles and the drag from weaker post-election years where late-cycle policy or macro shocks weighed on returns.
Individual years inside this phase have shown a broad range of outcomes. In 1985, the window produced a net gain of 20.99%, with a maximum favorable move of 21.16% and essentially no adverse excursion from the initial level, a textbook strong year for the pattern. At the other end of the spectrum, 1993 saw a net decline of 4.82%, with a maximum adverse move of 6.24%, while 2021 delivered a 3.23% loss with a worst intraperiod drawdown of 9.34%, illustrating that even late in the year after a presidential election the index has at times absorbed meaningful setbacks before the cycle turned more supportive again.
Looking across the whole sample, the maximum favorable excursion profile suggests that when this window works in the trade direction, it can do so by trending higher for extended stretches, while the maximum adverse excursion data show that pullbacks within the window can be sizeable even in years that ultimately finish positive. That balance aligns with a TradeWave Ratio of 0.97 and a Sharpe ratio of 0.1, indicating that the historical path has delivered constructive but not smooth risk-adjusted results.
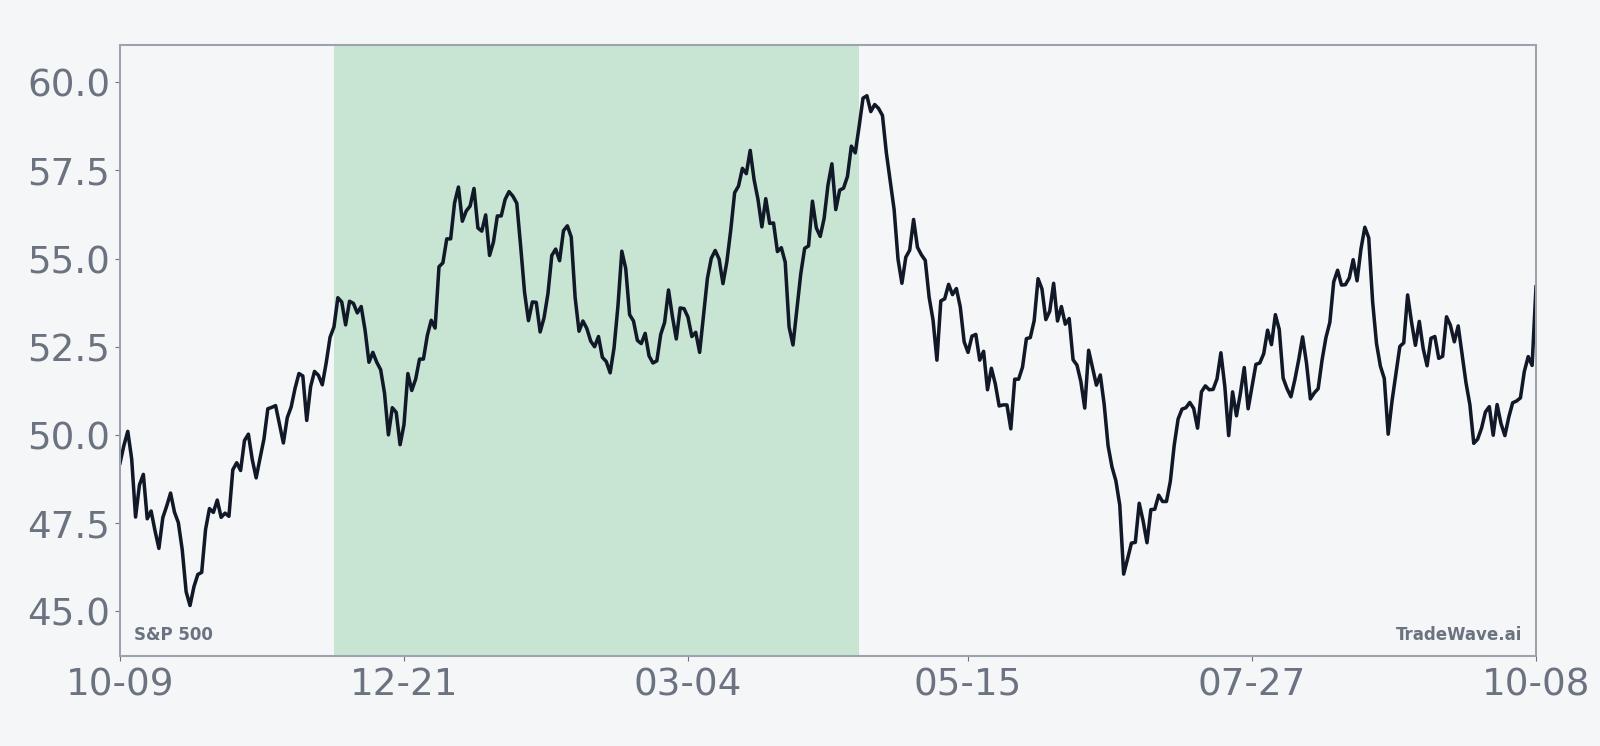
The historical seasonal trend line for this pattern slopes upward over the full 136 days, with gains tending to accrue in stages rather than in a straight line, which is consistent with a constructive but not runaway backdrop for long positions in this phase.
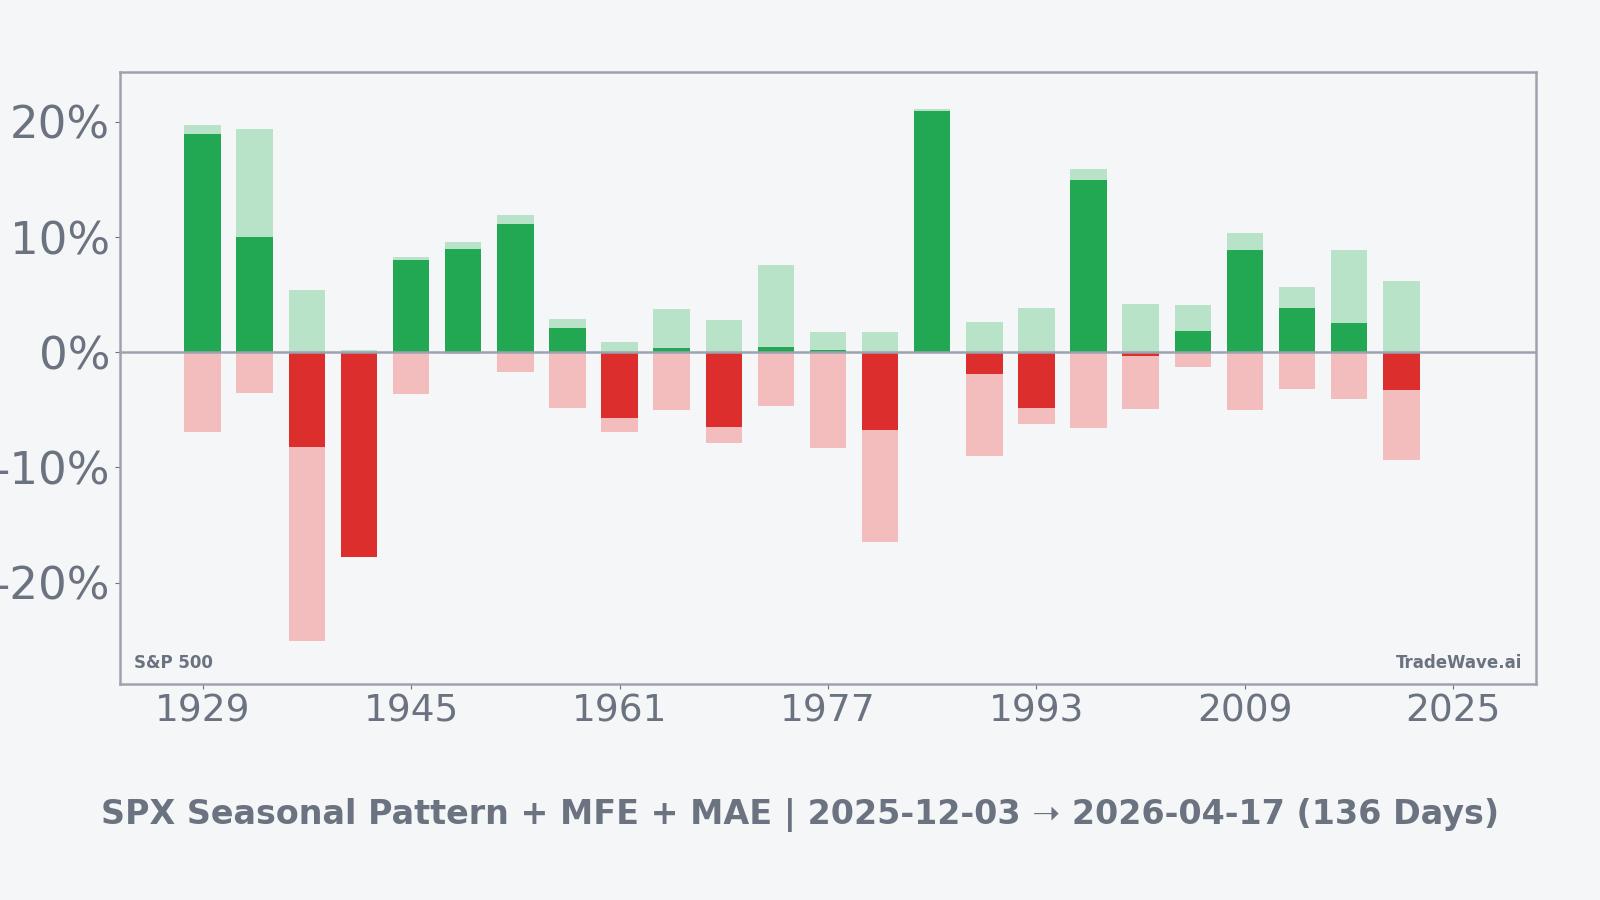
The per-year bar chart combining net results with maximum favorable and adverse excursions highlights that many winning years have featured robust upside runs alongside moderate drawdowns, while some of the weaker years have seen relatively deep intraperiod losses even when the final outcome was close to flat, reinforcing that this window has historically rewarded participation in the long direction but with volatility that can test risk tolerance.
History does not guarantee future results, and maximum adverse excursions (MAE) in this window have at times been large even in years that ultimately finished higher.
Taken together, the historical pattern defines the quantitative seasonal backdrop for the current period as a constructive but noisy stretch that concludes the year after the presidential election and leads into the transition toward the midterm-election-year playbook.
Price and near-term drivers
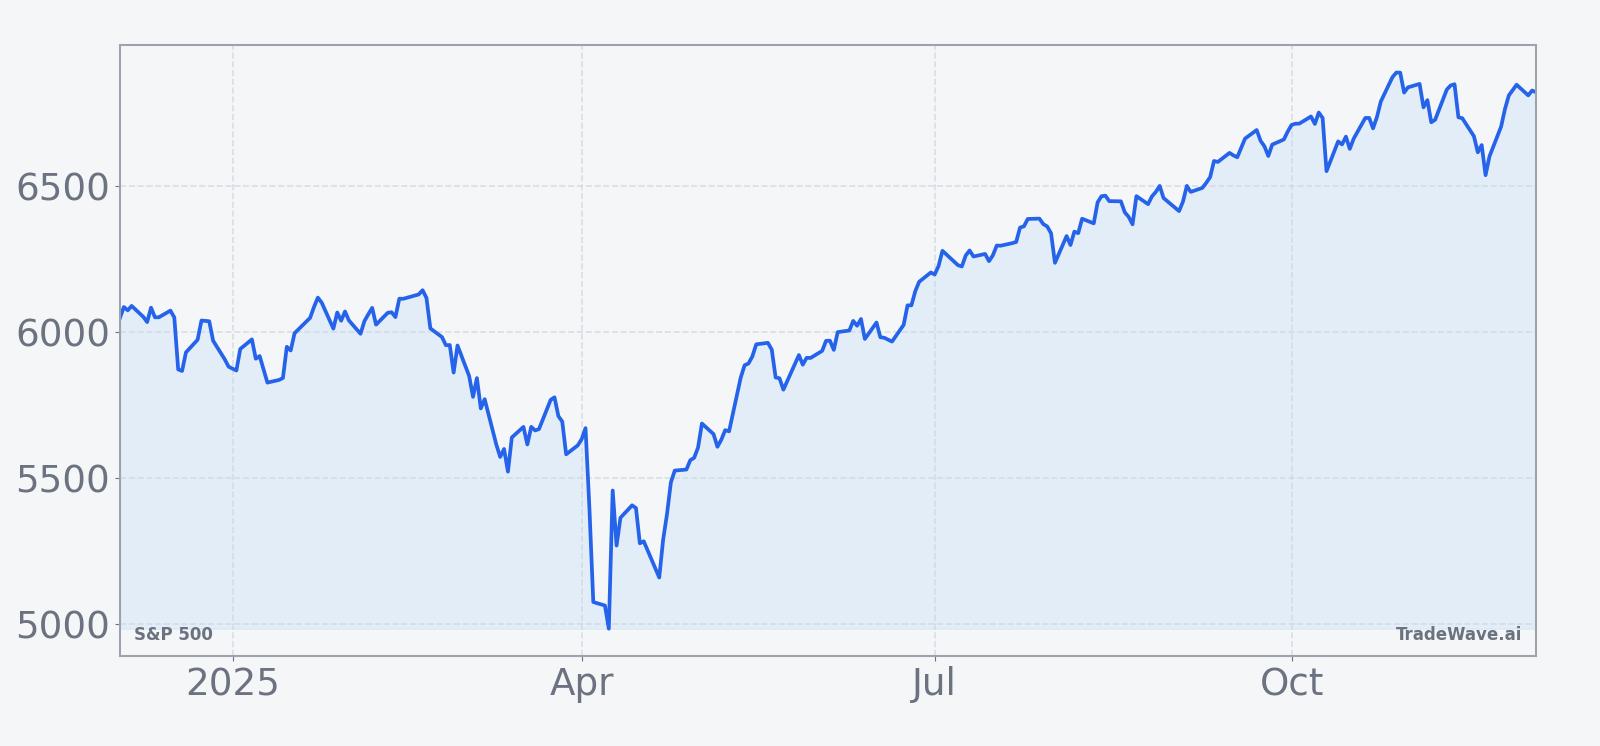
S&P 500 added 0.3% today to close at 6,849.72, bringing the index to within striking distance of its late October record as major benchmarks continued to grind higher on the back of megacap strength and calmer rate volatility.[1][7]
The chart below situates the latest move in the context of the past year of trading.
Recent gains have coincided with a shift in rate expectations, as weaker private payroll data and easing bond yields have encouraged markets to price in a high likelihood that the Federal Reserve will cut its policy rate at the December 9 to 10 meeting.[8][9] Futures linked to the federal funds rate now imply that an initial 25 basis point reduction is more likely than not, and broader equity benchmarks have responded by pushing toward or through prior highs.
The macro backdrop feeding into that decision has been one of gradually cooling inflation and a softer but still expanding domestic economy. Headline consumer price growth over the twelve months through September stood at around 3%, a step down from the peaks of the prior tightening cycle, while more recent projections from regional Federal Reserve economists point to inflation running near the high 2% to low 3% range into year end.[10][11] That combination of moderating price pressures and resilient activity has given policymakers room to pivot from aggressive tightening to a more balanced stance focused on not choking off the expansion.
Street expectations have moved in the same direction. Analysts at Bank of America, for example, now anticipate a December rate cut followed by additional reductions in 2026, a path that would keep real yields from tightening further as growth slows.[12] For an index that is already near records, the way this policy path is priced through the seasonal window could matter as much as the cuts themselves, since disappointments or upside surprises relative to the current path have historically driven some of the sharper swings in post-election-year windows.
What to watch in this window
From here, the most important benchmark for the seasonal pattern is how S&P 500 behaves as it oscillates around its late October peak near 6,920 while sitting about 1.0% below that level at the start of the window.[2] Persistent closes above or below this zone will determine whether the current cycle looks more like the stronger historical years, where trends persisted, or like the weaker post-election phases that saw rallies stall before the next leg of the four-year cycle.
The Federal Reserve meeting on Dec 9 to 10 is the first major catalyst inside the window, and traders will be watching whether the committee delivers the widely anticipated cut and how it frames the path for 2026.[9][12] Follow-through in Treasury yields and rate-sensitive sectors after that meeting will offer early clues about whether the seasonal tendency toward constructive but uneven returns can coexist with a new easing phase or if policy communication injects fresh volatility.
Inflation data and growth indicators will remain central as well. If consumer price releases and nowcasting estimates continue to cluster near the current 3% area, it would support the narrative that the Fed has room to ease without reigniting an inflation problem.[10][11] A renewed acceleration would complicate that picture and introduce the kind of macro shock that has historically turned otherwise positive post-election windows into much more difficult environments.
Finally, investors will want to track breadth inside the index as this 136-day phase develops. A seasonal pattern that has delivered 62% profitable windows with 15 winners and 9 losers has historically been most durable when gains have broadened beyond a narrow group of megacaps, while episodes where narrow leadership persists into the transition toward the midterm year have sometimes produced more pronounced reversals before the next phase of the cycle asserts itself.
Sources
- Yahoo Finance - S&P 500 (^GSPC) quote and price overview
- Wall Street Journal - S&P 500 Index price and 52-week range
- Slickcharts - S&P 500 year-to-date return statistics
- S&P Dow Jones Indices - S&P 500 index methodology and overview
- Seasonax - Election cycle and post-election year behavior of the S&P 500
- LPL Research - Stock markets and the four-year presidential election cycle
- Associated Press - How major US stock indexes fared Wednesday, 12/3/2025
- Reuters - Stocks rise as Fed outlook pushes US yields lower
- Federal Reserve - FOMC meeting calendar
- U.S. Bureau of Labor Statistics - Consumer Price Index summary
- Federal Reserve Bank of Cleveland - Inflation nowcasting dashboard
- Reuters - BofA expects December Fed cut and two more in 2026