NYSE Composite (NYA) set to enter a strong seasonal window in December
NYSE Composite is trading just below recent highs as investors digest mixed economic data, strong ETF inflows and improving breadth ahead of a late December seasonal window that has often leaned positive.

Key takeaways
- The upcoming NYSE Composite seasonal window begins on Dec 19, 2025 and spans 59 trading days, aligning with a period that has historically been favorable for long positions.
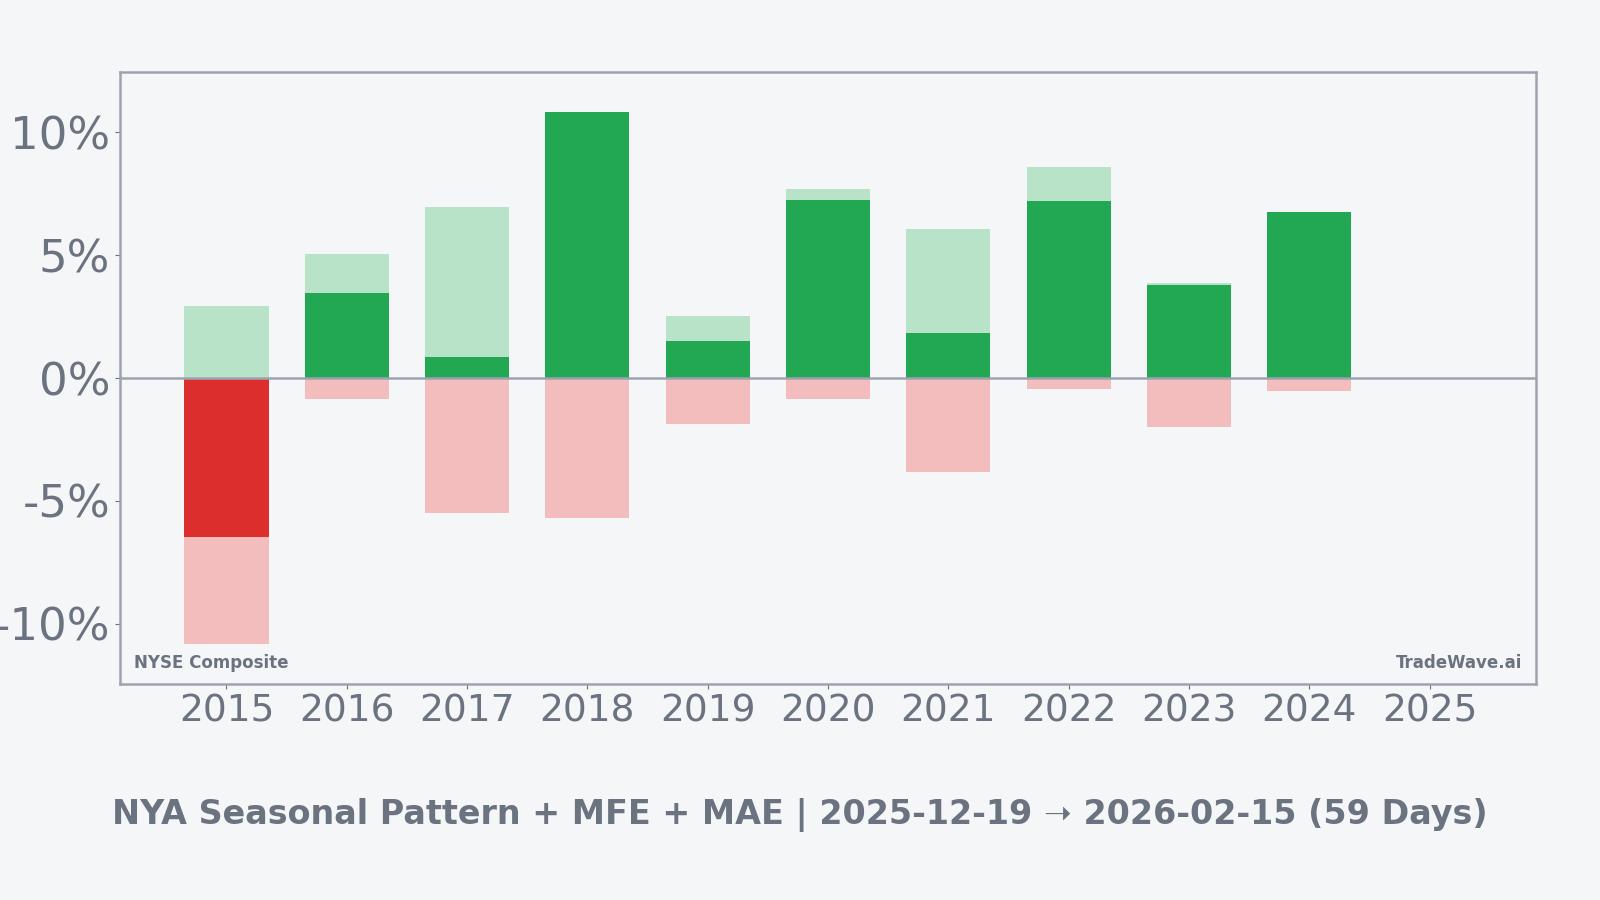
- Across the past 10 years this window has been profitable in 90% of cases, with 9 winners and 1 loser, and average gains of 4.84% in winning years versus 4% when all years are included.
- The pattern has generated a 42% cumulative return over the decade with a TradeWave Ratio of 2.11 and a Sharpe ratio of 0.64, indicating a consistent but not risk free upside profile.
- Intraperiod swings can be meaningful, with the weakest year in the sample losing 6.46% and seeing a maximum adverse move of 10.83% before recovering or closing, while the strongest year gained 10.83% within the window.
- NYSE Composite last closed at 21,650.48, about 1.0% below its 52-week high of 21,876.99, after a roughly 1.7% gain over the past month, leaving the index near the top of its recent range as the window approaches.[1][2]
- Broad US equity ETFs have attracted heavy inflows in recent weeks, and market breadth indicators on US exchanges have improved, setting up a historically supportive seasonal backdrop if participation remains wide.[8][9][10][11]
According to historical data from TradeWave.ai, this late December to early spring stretch has shown a distinct tendency for NYSE Composite to drift higher over time. The following section translates that seasonal pattern into plain English for context around the current market setup.
Seasonal window
This seasonal window begins on Dec 19, 2025 and spans 59 trading days, and has historically been a strong stretch for NYSE Composite in the data sample. Heading into early December trade, the index last closed at 21,650.48, about 1.0% below its 52-week high of 21,876.99, and sits near the upper end of its recent trading band after a roughly 1.7% advance over the past month.[1][2]
Across the 10-year lookback, the window has been profitable in 9 of 10 years, with average gains of 4.84% in the winning instances and a 4% average when both gains and losses are included. That combination of a high hit rate and moderate average advance has contributed to a 42% cumulative return for the window over the sample period, consistent with a supportive environment for long exposure rather than an extreme outlier regime.
The single losing year in the dataset came in 2015, when NYSE Composite fell 6.46% over the window and experienced a maximum adverse excursion of 10.83% from entry before stabilizing. By contrast, the strongest year was 2018, which delivered a 10.83% gain within the same calendar stretch and still saw an intraperiod drawdown of 5.7%, underscoring that historically positive windows can still involve uncomfortable pullbacks along the way.
The MFE and MAE profile across years shows that in most positive outcomes, the index has managed to push several percentage points higher at some stage of the window while keeping the deepest drawdowns limited compared with the 2015 outlier. Large maximum favorable moves paired with contained typical maximum adverse moves suggest a window where upside has usually outweighed downside, although the presence of one sharp loss year keeps the risk picture balanced rather than one sided.
The 10-year average seasonal trend line for this window slopes upward, with gains tending to build gradually rather than arriving in a single burst. In many years the pattern shows modest early gains, a period of consolidation and then additional upside later in the window, implying that traders who have historically participated have often needed patience rather than expecting an immediate surge.
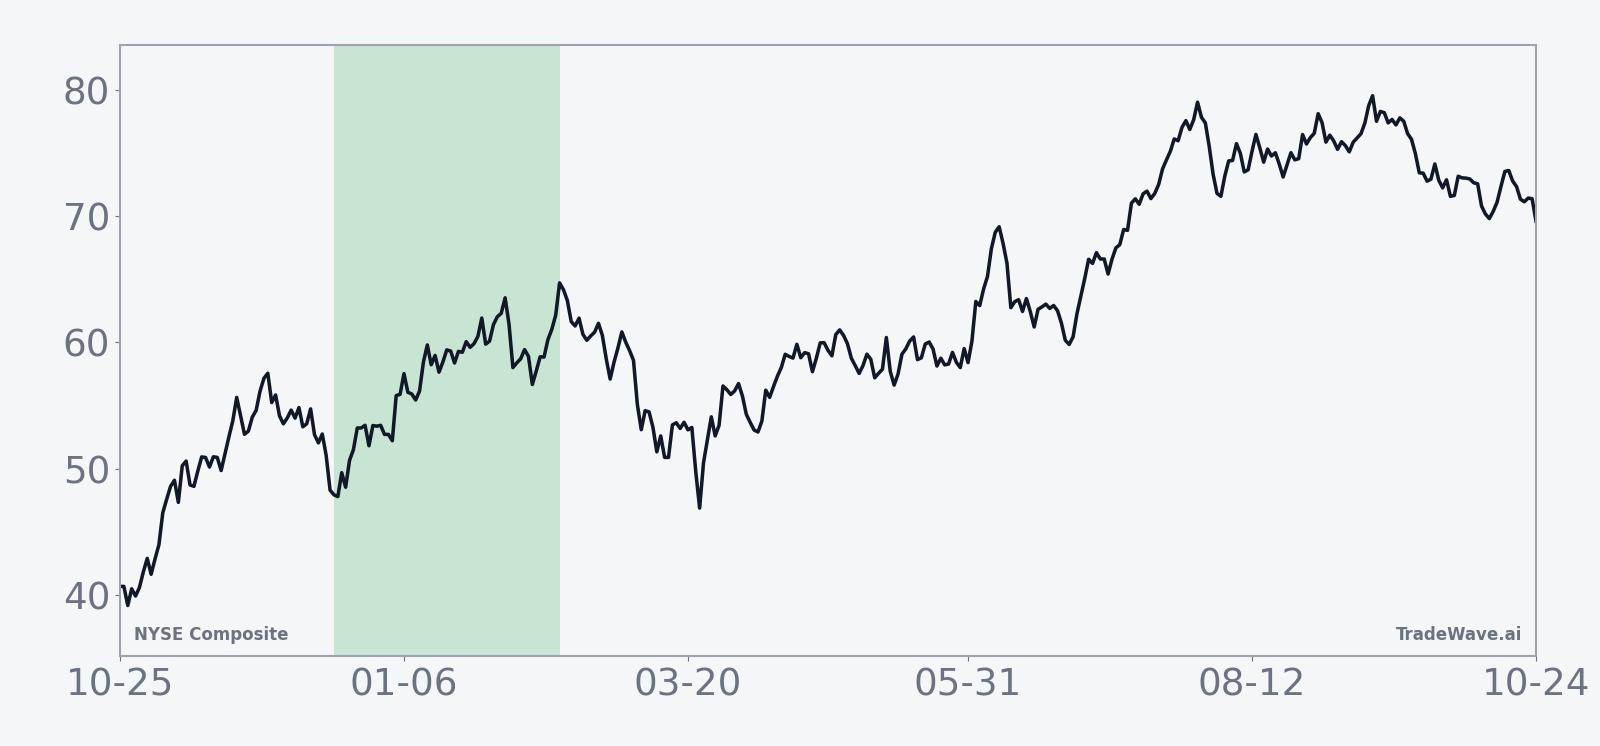
Year by year, the combination of net results and peak swings highlights persistent upside potential alongside recurring drawdowns inside the window.
The combination of a consistently positive seasonal average, a high share of winning years, and a TradeWave Ratio of 2.11, alongside a Sharpe ratio of 0.64 and occasional deep MAE readings, frames this window as historically constructive but not without volatility. Taken together, the historical pattern defines the quantitative seasonal backdrop for the current period.
History does not guarantee future results; adverse excursions (MAE) can be large even in winning windows.
For NYSE Composite, the late December to early spring stretch has more often than not added incremental upside, but the historical record shows that investors still had to live through meaningful swings to capture it.
Price and near-term drivers
On Wednesday the NYSE Composite traded near flat, holding close to recent highs as Wall Street indexes posted mixed moves, with technology shares lagging while other sectors proved more resilient.[3] Broader US equity benchmarks remain well up for the year, and global demand for US stocks has stayed firm, helped by expectations that the Federal Reserve could begin easing policy next year as inflation slows and growth moderates.[4][5]
The chart below situates the latest move in its recent multi-month context.
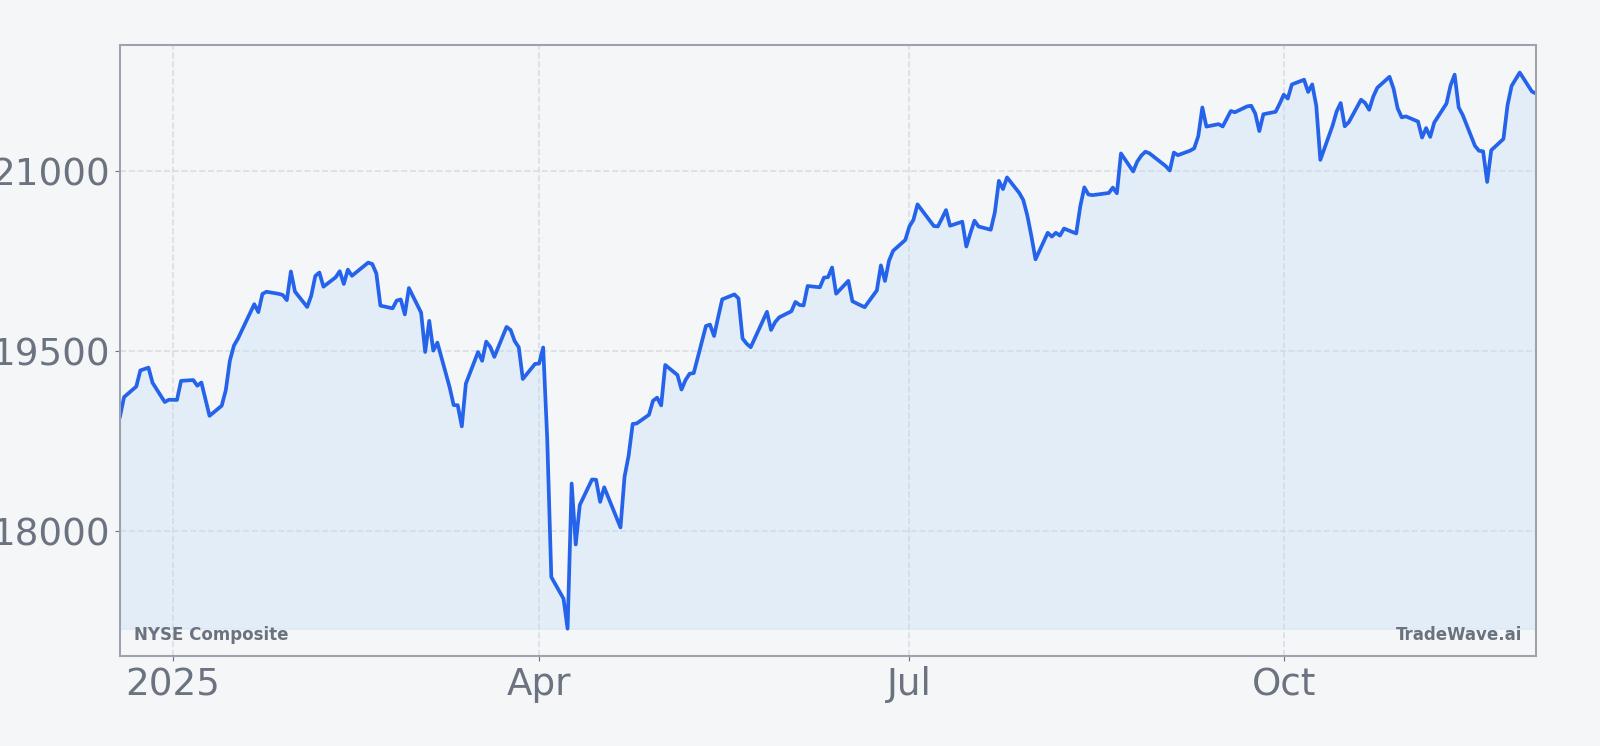
Recent macro data have reinforced that picture of a cooling but still expanding US economy. The latest ADP National Employment Report showed private sector employment falling by 32,000 jobs in November while annual pay growth eased to 4.4%, a combination that points to softer labor demand but continued wage support.[6] Manufacturing activity remains in contraction territory, with the ISM Manufacturing PMI at 48.2 in the most recent reading, signaling pressure in goods sectors even as services hold up.[7]
Under the surface, breadth has improved compared with earlier in the year. Strategists have highlighted that the NYSE advance-decline line has broken higher and that a larger share of S&P 500 and NYSE-listed constituents now trade above their 50-day and 200-day moving averages, suggesting participation has broadened beyond a handful of mega caps.[8] At the same time, recent trading sessions have shown technology heavyweights weighing on the Nasdaq while more cyclical and value-oriented segments have held steadier, a rotation that matters for an index like NYSE Composite that captures a broad cross section of the market.[3]
ETF flow data tell a similar story of persistent demand for US equities. In the holiday-shortened week ended Nov 27, US-listed ETFs drew about $28.3 billion in net new money, with broad equity funds capturing a substantial share of those inflows.[9] For the full month of November, investors added nearly $148 billion to US ETFs, one of the strongest monthly tallies on record and a sign that allocations into equities and related strategies have remained aggressive into year end.[10]
Flows have not been limited to the largest benchmarks. Daily ETF flow tallies show days when the small-cap focused iShares Russell 2000 ETF (IWM) has attracted some of the biggest single-session inflows in the market, while the tech heavy Invesco QQQ Trust has also ranked among the top recipients on several occasions.[11][12] That mix of money moving into both growth and cyclicals helps explain the healthier breadth backdrop for NYSE Composite as it moves toward its historically supportive seasonal window.
What to watch
With NYSE Composite already trading close to its 52-week high, the first set of levels to watch as the window opens on Dec 19 will be how the index behaves around the 21,876.99 peak and the recent consolidation band just below it.[1] A sustained break higher with only modest pullbacks would look similar to many of the historical winning years for this window, while repeated failures near the highs or a quick drop back into the prior range would signal a possible deviation from the usual pattern.
Market breadth will be equally important. If the share of NYSE and S&P 500 constituents above their 50-day and 200-day moving averages continues to climb and the advance-decline line holds its recent breakout, it would reinforce the idea that any strength during the window is coming from a broad base rather than a narrow leadership group.[8] By contrast, a renewed narrowing of participation even as the headline index hovers near records would make the seasonal tailwind more fragile.
ETF flows offer another real time gauge of conviction. Continued net inflows into large core vehicles alongside periodic surges of demand for small-cap and technology funds such as IWM and QQQ would be consistent with the constructive seasonal profile that has characterized this window over the past decade.[9][10][11][12] A reversal into sustained outflows, particularly if it coincides with weaker breadth, would be an early sign that investors are backing away from the risk-on stance that has often accompanied this period in prior years.
Finally, upcoming macro releases will set the tone for how much of the historical pattern can assert itself. Monthly labor data, successive ISM surveys and the Federal Reserve’s decisions on policy rates will shape expectations for growth and earnings, which in turn influence whether investors are willing to keep pushing a broad index like NYSE Composite higher into early 2026.[5][6][7] How the index trades through those catalysts inside the 59-day window will reveal whether this cycle again rhymes with the past or breaks from it.
Sources
- Yahoo Finance - NYSE Composite Index (^NYA) quote overview
- MarketWatch - NYSE Composite Index performance and 52-week range
- Reuters - Wall Street mixed as Microsoft drags tech, data in focus
- Reuters - Global demand for US stocks is not waning; it is increasing
- Reuters - TRADING DAY: Fed hopes fire risk rally
- ADP Newsroom - ADP National Employment Report for November 2025
- Investing.com - United States ISM Manufacturing PMI economic calendar
- Investing.com - S&P 500 technicals look favorable for a Santa rally to commence
- ETF.com - Weekly ETF flows: $28.3 billion added in holiday-shortened week
- ETF.com - November 2025 ETF flows near record levels
- ETF.com - Daily ETF flows: Hefty inflows for IWM
- ETF.com - Daily ETF flows: QQQ takes top spot