S&P 500 (SPX) moves into a historically weak year-after-election seasonal window
The S&P 500 is hovering just below record highs as a long, year after election seasonal window opens that has often produced choppy, downside skewed trading even in otherwise supportive macro conditions.

Key takeaways
- The current S&P 500 seasonal window begins on Dec 3, 2025 and runs for 272 trading days, capturing the end of the year after the presidential election and the start of the midterm election year.
- Trade Direction for this pattern is short, reflecting a historical tendency for weaker or drifting lower behavior in this phase rather than sustained rallies.
- Across the lookback, the pattern has been profitable for the short side in 58% of years, with 14 winners and 10 losers, and winning years have posted an average move of 11.04% in the trade direction.
- Once losing years are included, Avg Profit All falls to 2%, highlighting that several strong upside squeezes, such as 1985 and 2013, have worked against the seasonal short bias.
- The MAE and MFE profile shows that some years produced deep intraperiod drawdowns, including a maximum adverse move of more than 30% in 2001, while others allowed shorts to withstand only shallow rallies before trends reasserted.
- With the index now near record territory, this mixed but downside skewed pattern becomes an important backdrop as investors navigate inflation reports, Fed meetings and a sizable federal deficit into the midterm year.
According to historical data from TradeWave.ai, this long year after election window has displayed a distinctive short biased profile that differs from the more familiar pre election strength many investors focus on.
Seasonal window
This seasonal window is currently underway, spanning 272 trading days, and has historically been a weak to choppy stretch for the S&P 500 in the year after the presidential election. The index was recently trading around 6,840, about 1.2% below its late October 52 week high near 6,920 after another modest midweek gain left it near record territory and up roughly the mid teens in percentage terms year to date.[1][2][3][4][5]
Pattern phase equals the year after the presidential election, and the calendar is also in the late part of that same phase, with markets preparing to pivot into the midterm election year. Grouping years by this four year political cycle matters because fiscal stance, regulatory priorities and the timing of key policy debates often repeat in this rhythm, shaping liquidity, risk appetite and volatility in recognizable ways even when individual headlines differ from one cycle to the next.[12]
Within this year after election grouping, the seasonal pattern for S&P 500 is calibrated as a short setup. Historically, the window has produced profitable outcomes for the short side in 58% of years, with 14 winning seasons and 10 losing ones. In the winners, the index has moved an average of 11.04% in the trade direction over the full window, while including all years, winners and losers together, reduces Avg Profit All to 2%, underscoring how a handful of strong rallies can offset many modestly negative seasons. Average losses in losing years have been about 11.44%, and the Sharpe ratio based on end of window outcomes sits at minus 0.1, reflecting the uneven payoff profile across decades.
TradeWave Ratio (TWR) is defined as how far price typically travels in the trade direction within the window, independent of the final close. MFE and MAE together provide another lens on intraperiod risk: MFE/MAE are the best and worst intraperiod excursions from the entry, representing the peak run up and the worst drawdown within the window. In one of the stronger short friendly years, 2001, the index ultimately fell about 22.29% over the window and experienced a maximum adverse move of roughly 31.35% from the entry before stabilizing, while a year like 1985 saw a 23.73% upside surge with a maximum favorable excursion above 26%, a clear losing year for the short pattern despite limited downside pauses. More recently, 1997 delivered a maximum favorable run of about 21.89% for longs during the window yet still finished with a modest negative net return of roughly 2% as those gains reversed before the exit point.
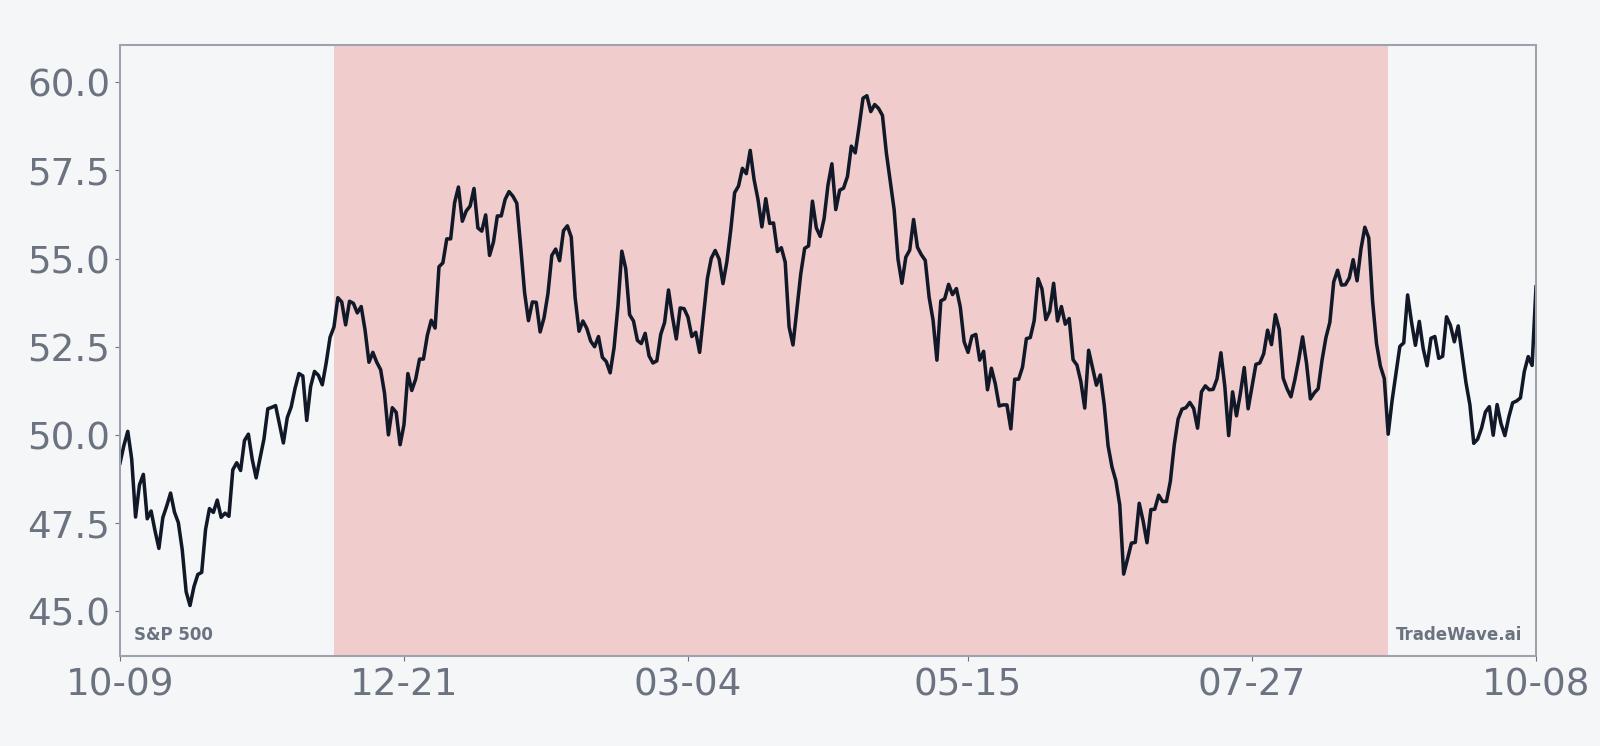
The historical seasonal trend chart for this window shows a pattern that tends to struggle to build sustained gains in the year after the election. The average path across decades leans gently lower over the full span rather than grinding higher, with pockets of early strength often giving way to mid window weakness and late stage recovery attempts that fall short of reclaiming earlier peaks.
The cumulative return view reinforces this picture of uneven progress. Returns have tended to accumulate in bursts rather than smoothly, with clusters of strongly negative windows offset by several powerful rallies that skew averages upward. That mix explains why cumulative return for the short pattern can be positive even though the Sharpe ratio is negative and why investors should focus on the distribution of outcomes rather than headline averages alone.
Year by year net results and the combined MFE and MAE ranges highlight how often this window has seen sharp moves in both directions before settling.
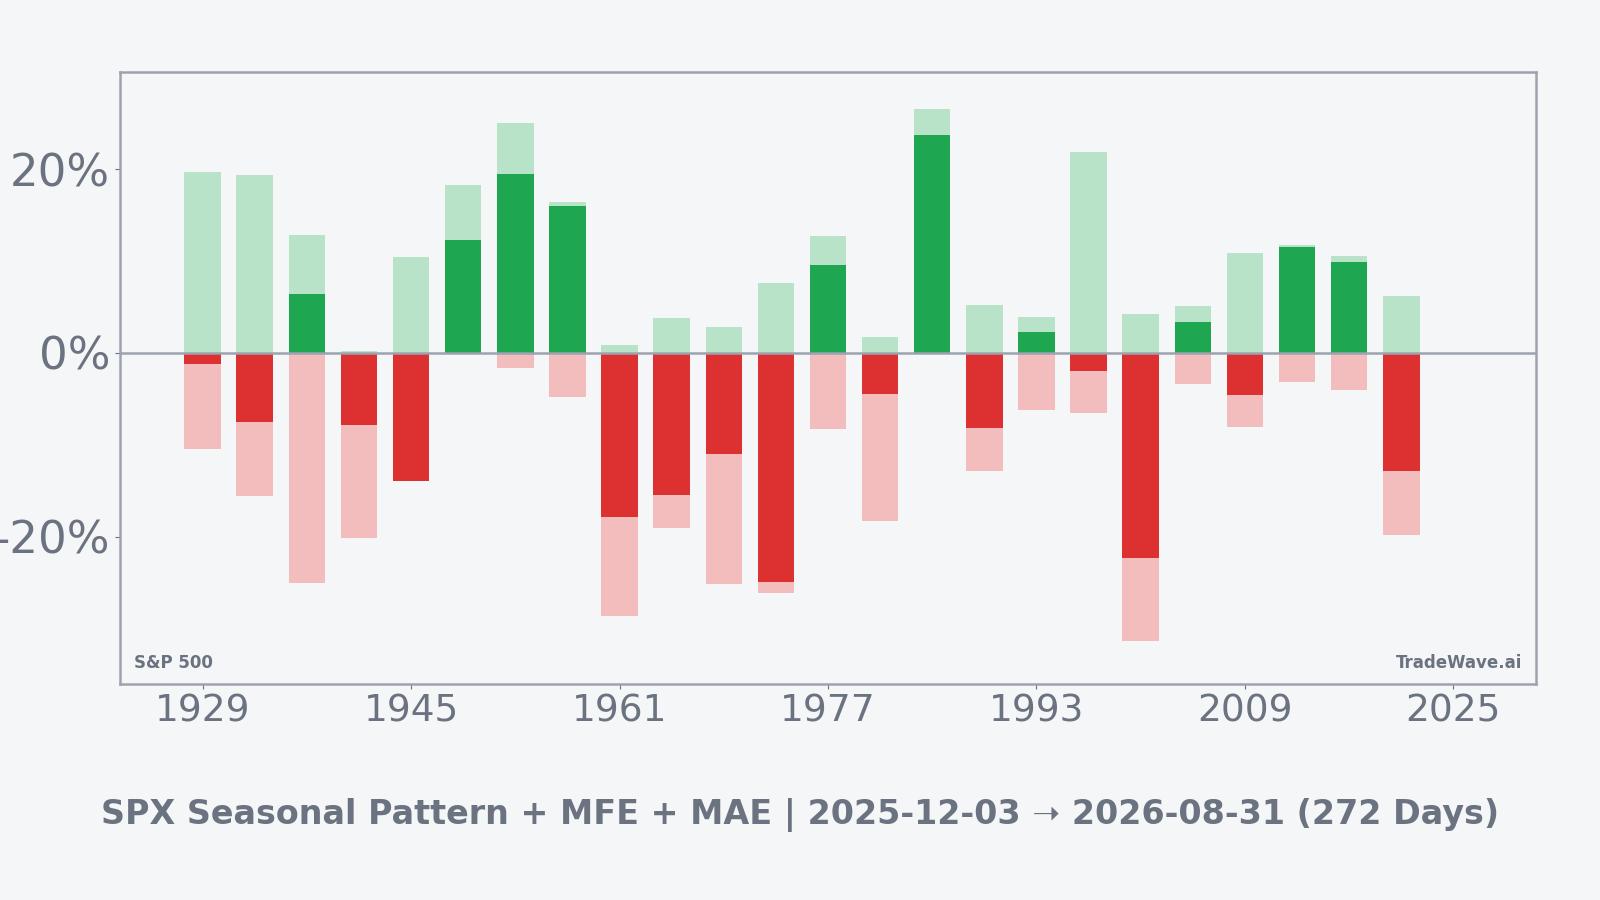
In combination, the per year bars, maximum favorable excursions and maximum adverse excursions suggest a window where trends, once established, can travel meaningfully in the short direction but also where several years have delivered powerful squeezes against shorts. That makes position sizing and risk controls critical if investors choose to lean into the historical bias rather than simply treating it as background context.
History does not guarantee future results, and maximum adverse excursions can be large even in winning windows, so any seasonal edge should be weighed against other risk management and macro considerations.
Price and near-term drivers
The S&P 500 edged higher in Wednesday trading, hovering around the 6,840 level after a series of advances that left the index just shy of its late October record high and roughly 15.8% higher for the year through earlier this week.[1][2][3][4][5] Gains have been broad but not frenetic, with investors rotating between mega cap growth, cyclicals and defensives as they balance resilient earnings against signs that the US economy is cooling at the margin.[5]
Recent data have reinforced that softer tone. Private payrolls declined in November for the first time in about five years, according to ADP figures that showed companies trimming headcount in interest rate sensitive sectors even as overall unemployment remains low.[6] The services sector has continued to expand, but the latest Institute for Supply Management survey pointed to a slower pace of growth and some easing in price pressures, consistent with a gradual deceleration rather than an abrupt downturn.[7]
Inflation has also moved closer to the Federal Reserve's target. Headline consumer price growth has eased toward the low 3% range on a year over year basis, while key measures of personal consumption expenditures inflation have drifted below that level, helped by cooling goods prices and more stable shelter costs.[9][10][14] Fed officials have acknowledged the progress but remain cautious, emphasizing in recent speeches that inflation is still above the 2% goal and that they are weighing the risk of cutting borrowing costs too early against the risk of holding them too high for too long.[14][15]
Minutes from the Fed's late October meeting showed a divided committee, with some policymakers comfortable signaling a path toward rate cuts in 2026 while others preferred to keep a tightening bias until inflation is firmly anchored.[8] Market participants, however, have increasingly priced in the possibility of an earlier move, with one prominent survey of strategists and investors pointing to rising odds of a first reduction around the turn of the year rather than well into 2026.[11] That evolving policy narrative is central to how traders interpret the year after election seasonal window, since easier financial conditions could blunt its historical short bias while renewed rate anxiety could amplify it.
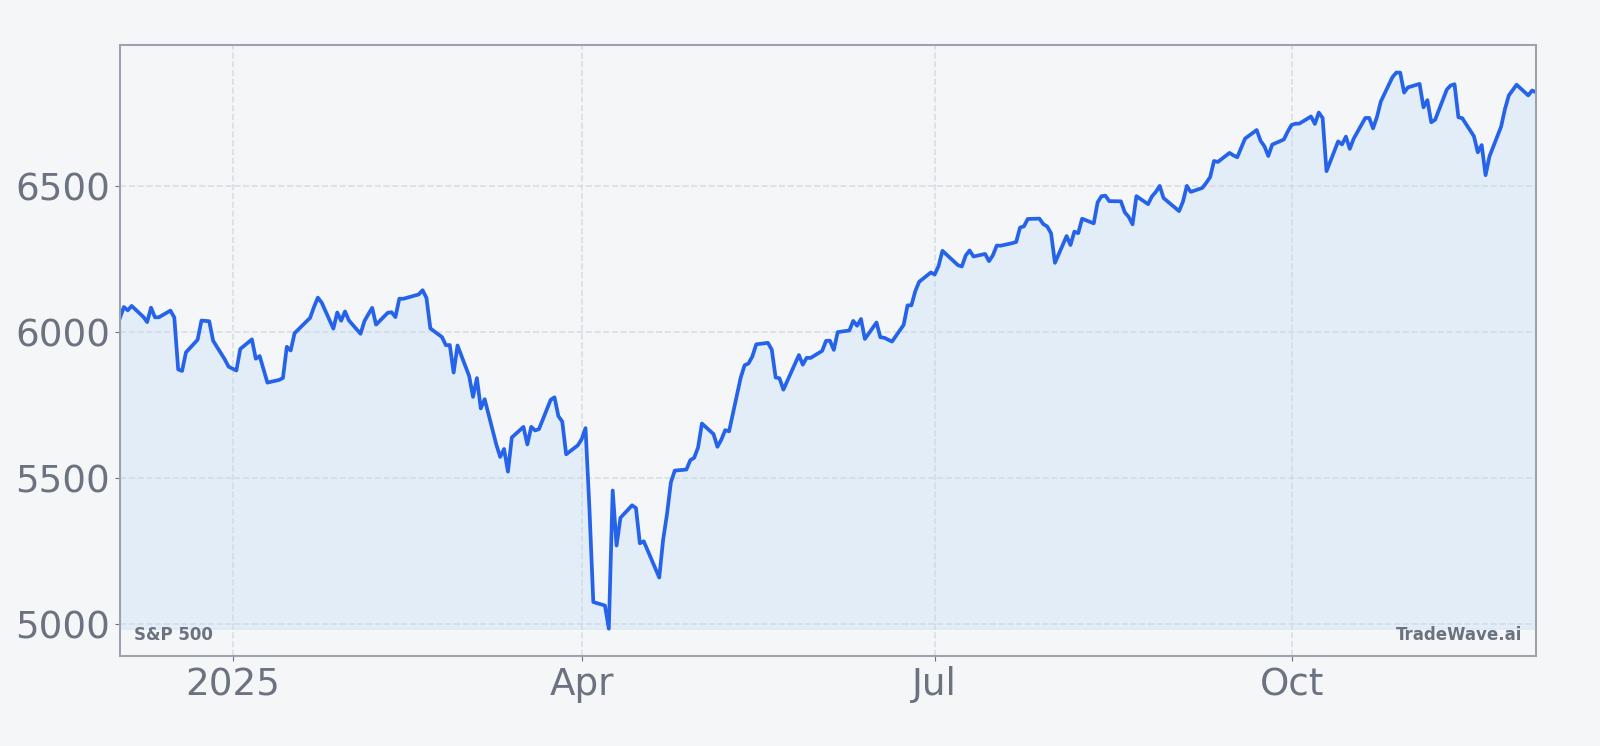
The chart below situates the latest move in its recent multi month context, highlighting the climb back to record territory after earlier drawdowns.
What to watch
The next several weeks will offer early clues about whether this year after election window follows its historically weak and choppy template or instead behaves more like the powerful late cycle rallies that have occasionally overwhelmed the short bias. On the macro side, investors will be watching upcoming consumer price index and personal consumption expenditures reports, which will shape perceptions about how quickly inflation is converging toward the Fed's target and how soon policymakers can pivot firmly toward easing.[9][10][13]
The December 9 to 10 Federal Open Market Committee meeting is another key waypoint, as updated projections and press conference commentary will clarify whether officials see the balance of risks tilting toward growth or inflation as the cycle moves from the year after the election into the midterm year.[8] Any shift in tone around the pace of balance sheet runoff or the longer run policy rate could change how sensitive equity valuations are to incoming data and potentially alter how the seasonal pattern plays out in practice.[11]
At the same time, the fiscal backdrop remains a structural consideration. The latest Congressional Budget Office estimates point to a federal deficit of about 1.8 trillion dollars in fiscal 2025, only slightly narrower than the prior year, underscoring that Treasury issuance is likely to stay heavy even as the Fed eventually steps back from restrictive policy.[12] In prior cycles, similar combinations of elevated deficits and shifting monetary stances have coincided with periods of higher volatility, particularly in the early part of the midterm year when markets reassess the durability of earnings and the sustainability of multiples.
For equity traders and allocators, the historical message of this window is less about a guaranteed downside outcome and more about acknowledging a regime where negative seasons have been common, rallies against shorts can be sharp and intraperiod drawdowns have at times been deep. Monitoring how the index behaves around macro releases, Fed communication and fiscal debates will help determine whether 2025 to 2026 falls into the bucket of years that tracked the seasonal short bias or the smaller set where persistent strength turned this window into a notable outlier. Taken together, the historical pattern defines the quantitative seasonal backdrop for the current period.
Sources
- Yahoo Finance - S&P 500 (^GSPC) index quote and recent levels
- The Wall Street Journal - S&P 500 Index overview and 52 week range
- Associated Press - Stocks rise on Wall Street as S&P nears record
- KVUE / AP - Stocks move higher on Wall Street as S&P remains up for the year
- Yahoo Finance - Stocks drift back toward record highs as final month of 2025 begins
- Financial Times - US private sector sheds jobs for first time in five years
- MarketWatch - ISM services index shows slower growth and easing price pressures
- Federal Reserve - Minutes of the Federal Open Market Committee, October 28 29, 2025
- Bureau of Labor Statistics - Consumer Price Index latest release and inflation detail
- Bureau of Economic Analysis - Personal Income and Outlays, including PCE price index
- Reuters - Investors shift expectations for timing of the first Fed rate cut
- Committee for a Responsible Federal Budget - CBO: FY 2025 budget deficit totaled 1.8 trillion dollars
- Barron's - Why the next PCE inflation report matters for the Fed and markets
- Federal Reserve Bank of Dallas - Trimmed mean PCE inflation through October 2025
- Federal Reserve Bank of Atlanta - Weighing the risks: why inflation tips the scales