Arthur J. Gallagher & Co. (AJG) steadies above lows as brokers firm into year end
Arthur J. Gallagher & Co. rose in afternoon trade, rebounding from recent weakness and sitting well below its 52-week high as investors parse fresh quarterly results and a busy pipeline of industry deals.
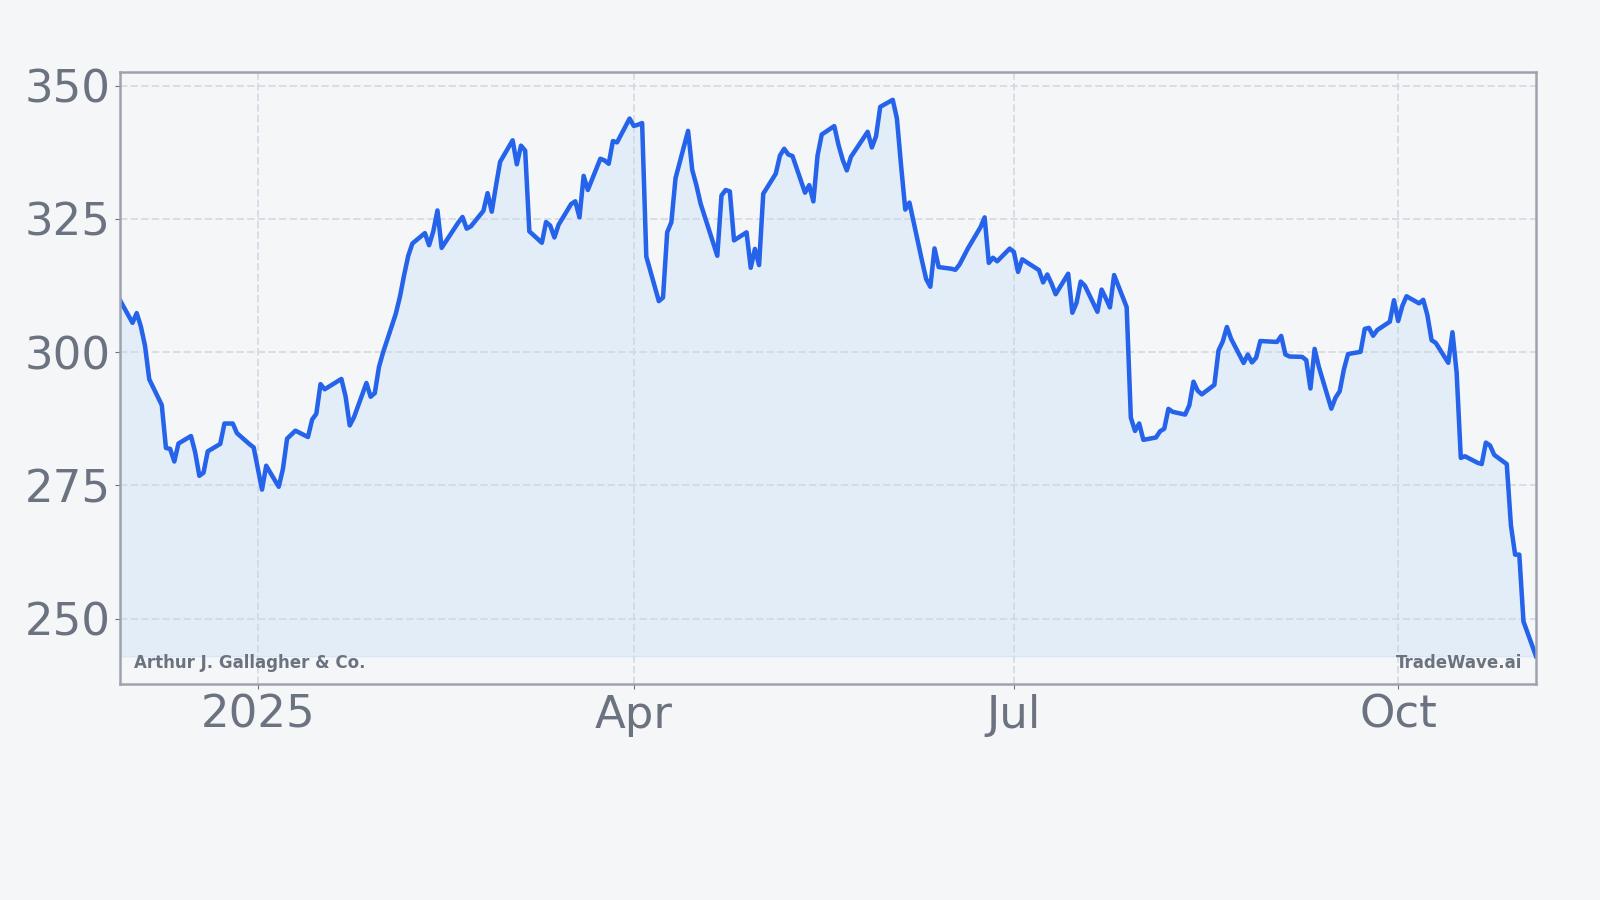
Arthur J. Gallagher & Co. traded higher around $248 in New York, up a little over 2% on the day. That leaves the insurance broker roughly 29% below its 52-week high at $351.23 and about 3.5% above the 52-week low at $239.47, a range that frames a volatile autumn for the group.[1]
Drivers and news
The company reported third quarter results on Oct 30, noting organic revenue growth of 4.8% and more than $450 million of incremental revenue from acquisitions. Management highlighted a 13.8% net earnings margin and a 32.1% adjusted EBITDAC margin for the period.[2]
Gallagher had preannounced the earnings date on Oct 9. The post quarterly update reinforced the continued contribution from the firm’s acquisition program, a long running component of its growth model.[3]
On the sell side, several providers maintain constructive views on the franchise, and the latest aggregated read shows a balanced positive stance. The average one year price target compiled by Nasdaq sits near $347.85, with a range of $275.17 to $407.40 after late October updates.[4] MarketBeat’s consolidated recap of the Oct 30 print flagged an EPS miss versus consensus alongside double digit revenue growth, underscoring a mixed near term takeaway heading into the seasonally active fourth quarter.[5]
Macro and sector context
Insurance brokers continue to sit within a healthier corner of financials, supported by firm pricing in commercial lines and steady exposure to rising insured values. Within the S&P 500 insurance industry group, performance has been choppy through the fall, but brokers as a sub industry remain a relative bright spot on fundamentals as interest rate volatility eases.[6][7]
Brokers have leaned on pricing discipline and acquisition pipelines to offset episodic macro noise and earnings lumpiness.
Valuation markers
At today’s levels, Reuters lists Arthur J. Gallagher & Co. with a forward P/E near 22.4 and a TTM P/E excluding items near 39.7. The stock also screens with a dividend yield around 1.04% on the Reuters page.[1]
The company’s investor relations site shows a regular quarterly dividend of $0.65 per share, with the next ex date on Dec 5 and payable on Dec 19, keeping Gallagher’s income profile intact into year end.[8]
Earnings setup
Looking ahead, Zacks’ calendar pegs the next earnings release for Jan 29, 2026, with a current consensus EPS estimate of $2.57 for the upcoming quarter.[9] Yahoo Finance previewed the October report with expectations for year over year growth in both revenue and EPS, consistent with management’s emphasis on acquisition contributions and organic expansion.[10]
Across the Street, the average price target sits near the mid $340s with upside skew from select brokers and a low case in the mid $270s, framing a broad dispersion that reflects both execution confidence and integration, margin, and macro variables.[4]
Seasonal window
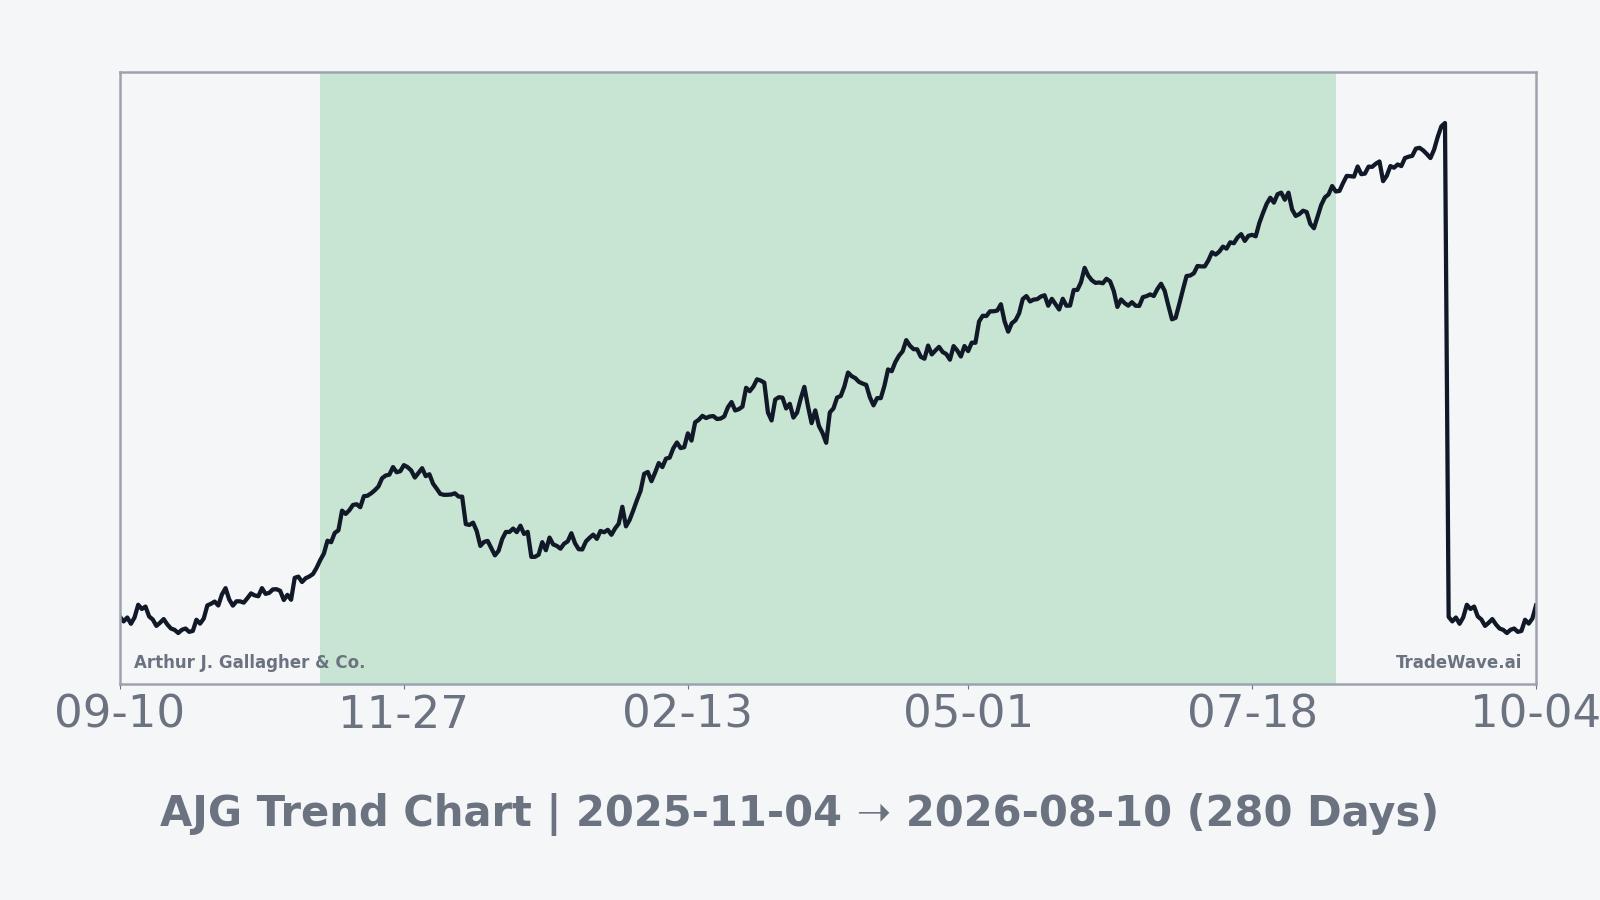
TradeWave seasonal analytics track a long setup for Arthur J. Gallagher & Co. beginning on Nov 4, 2025 and running 280 trading days based on 10 years of history. In this sample, Percent Profitable is 100% with 10 winners and 0 losers, the Avg Profit is 17.7%, the TradeWave Ratio is 2.88, and the Sharpe ratio is 2.14. TradeWave Ratio (TWR) is defined as how far price typically travels in the trade direction within the window, independent of the final close. The Sharpe ratio is the risk adjusted average return based on end of window outcomes. MFE/MAE refer to the best and worst intraperiod excursions from the entry, meaning the peak run up and the worst drawdown within the window.
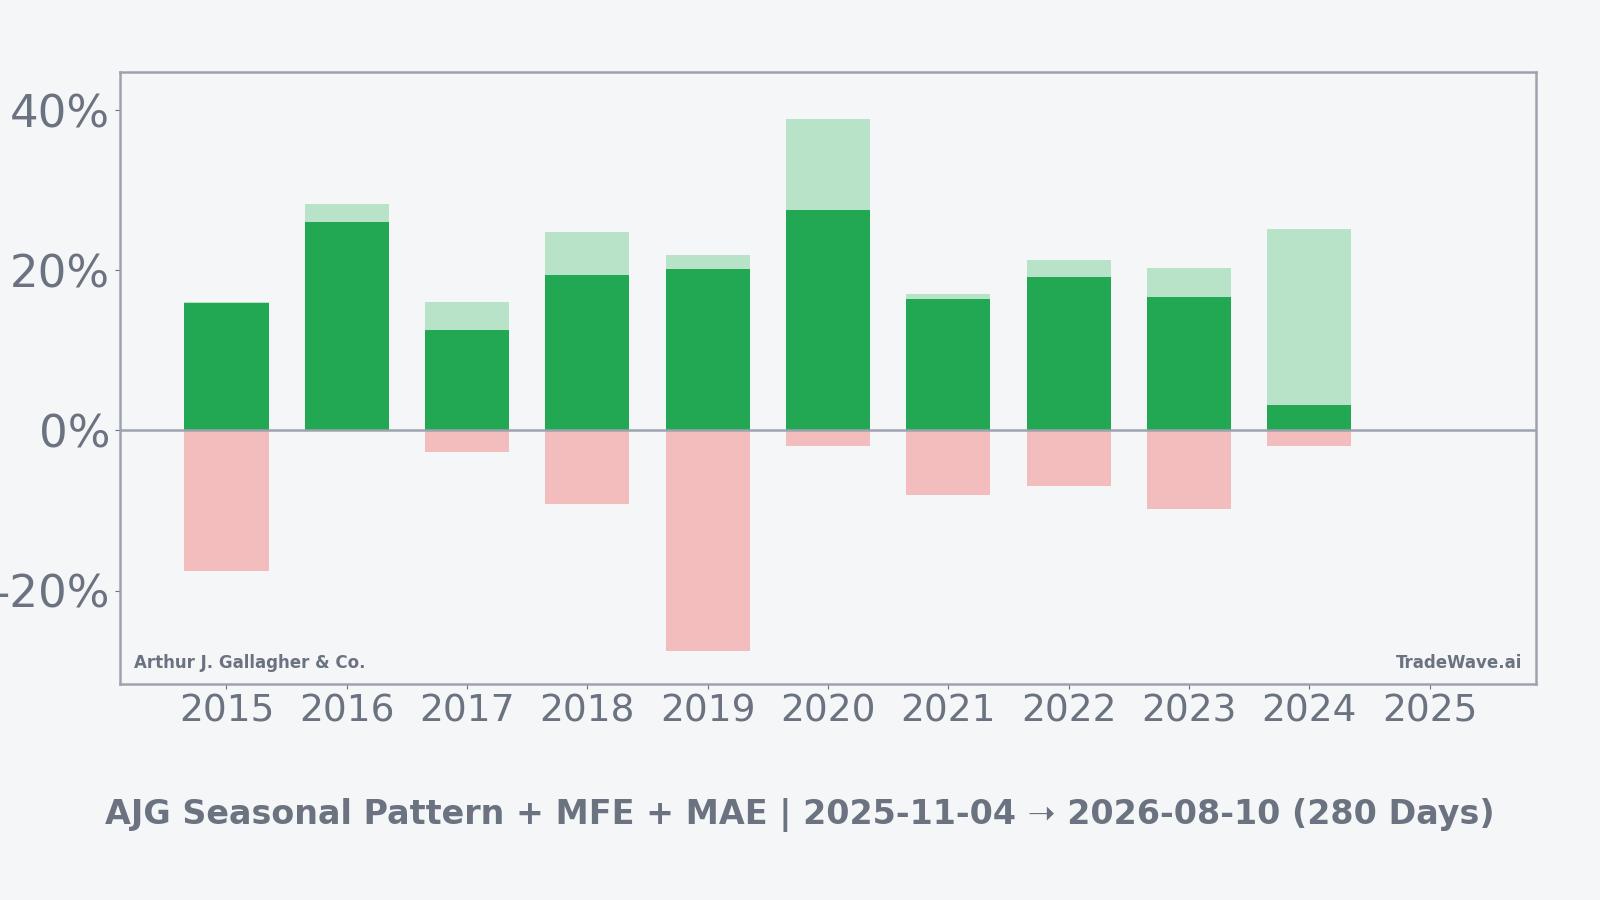
The per year view shows 2020 as the strongest outcome with a net return of 27.47% and a peak favorable excursion of 38.92%. The softest outcome was 2024 with a net return of 3.19% despite a sizable intraperiod rally, while 2019 featured the largest single year drawdown with a maximum adverse excursion of −27.53% before finishing higher. These excursions illustrate how positive windows can still include meaningful swings inside the period.
History does not guarantee future results, and MAE can be large even in winning windows.
Wrap
Arthur J. Gallagher & Co. is bouncing into the late year period with shares closer to the bottom of their 52-week range than the top, a valuation profile that screens in line with high quality insurance brokers, and a consistent dividend cadence. The company’s Oct 30 update keeps the focus on integration, margins, and the pace of organic growth as industry pricing and exposure trends evolve.[2][1]
What to watch: the next earnings print expected on Jan 29, 2026, Street EPS tracking near $2.57, and whether shares can hold above recent lows while the group stabilizes. Also watch any updates to acquisition close timing and integration progress, plus how forward P/E around the low 20s shifts with estimates and sector moves.[9][1]
Sources
- Reuters, “Arthur J. Gallagher & Co. AJG Quote, Key Metrics and 52-week range,” Nov 4, 2025. https://www.reuters.com/markets/companies/AJG/
- Arthur J. Gallagher & Co. Investor Relations, “Third Quarter 2025 Financial Results,” Oct 30, 2025. https://investor.ajg.com/news/news-details/2025/Arthur-J--Gallagher--Co--Announces-Third-Quarter-2025-Financial-Results/default.aspx
- Arthur J. Gallagher & Co. Investor Relations, “Q3 2025 Earnings Release and Conference Call Date,” Oct 9, 2025. https://investor.ajg.com/news/news-details/2025/Arthur-J--Gallagher--Co--Announces-Third-Quarter-2025-Earnings-Release-And-Conference-Call-Date/default.aspx
- Nasdaq, “Keefe, Bruyette & Woods Maintains Arthur J. Gallagher; Average Target $347.85,” Oct 31, 2025. https://www.nasdaq.com/articles/keefe-bruyette-woods-maintains-arthur-j-gallagher-ajg-market-perform-recommendation
- MarketBeat, “Arthur J. Gallagher & Co. Earnings,” Oct 30, 2025. https://www.marketbeat.com/stocks/NYSE/AJG/earnings/
- MarketWatch, “S&P 500 Insurance Industry Group Index overview,” accessed Nov 4, 2025. https://www.marketwatch.com/investing/index/sp500.4030
- MarketWatch, “S&P 500 Insurance Brokers Sub Industry Index overview,” accessed Nov 4, 2025. https://www.marketwatch.com/investing/index/sp500.40301010
- Arthur J. Gallagher & Co. Investor Relations, “Dividends,” updated Oct 29, 2025. https://investor.ajg.com/dividends/default.aspx
- Zacks, “AJG Earnings Calendar and Estimate,” accessed Nov 4, 2025. https://www.zacks.com/stock/research/AJG/earnings-calendar
- Yahoo Finance, “Arthur J. Gallagher (AJG) Earnings Expected to Grow,” Oct 23, 2025. https://finance.yahoo.com/news/arthur-j-gallagher-ajg-earnings-140018516.html