Caterpillar (CAT) has entered a historically strong seasonal window into 2026
Caterpillar shares are trading near record highs as the stock moves into a historically strong 240-day seasonal window that will run deep into 2026, shaping how investors balance upside potential with policy and legal risks.

Key takeaways
- A 240-trading-day seasonal window for Caterpillar began on Dec 2, 2025 and has historically been a strong stretch for the stock, with a long trade direction bias over the past decade.
- Across 10 years of data, this window has been profitable in 90% of cases, with 9 winners and only 1 loser, and winning years have averaged a 14.39% gain while all years together averaged 13%.
- Historical excursions inside the window have included sizeable swings, with some years showing deep adverse moves even when the final outcome was positive.
- Caterpillar is currently trading just a few percent below its 52-week high, leaving the stock near the top of its range as investors weigh tariff headwinds, AI data center demand and legal risk around new patent litigation.
- Analysts see solid fundamentals into 2026, but valuation has moved to a premium, making the interaction between this seasonal backdrop, earnings delivery and macro conditions critical for positioning.
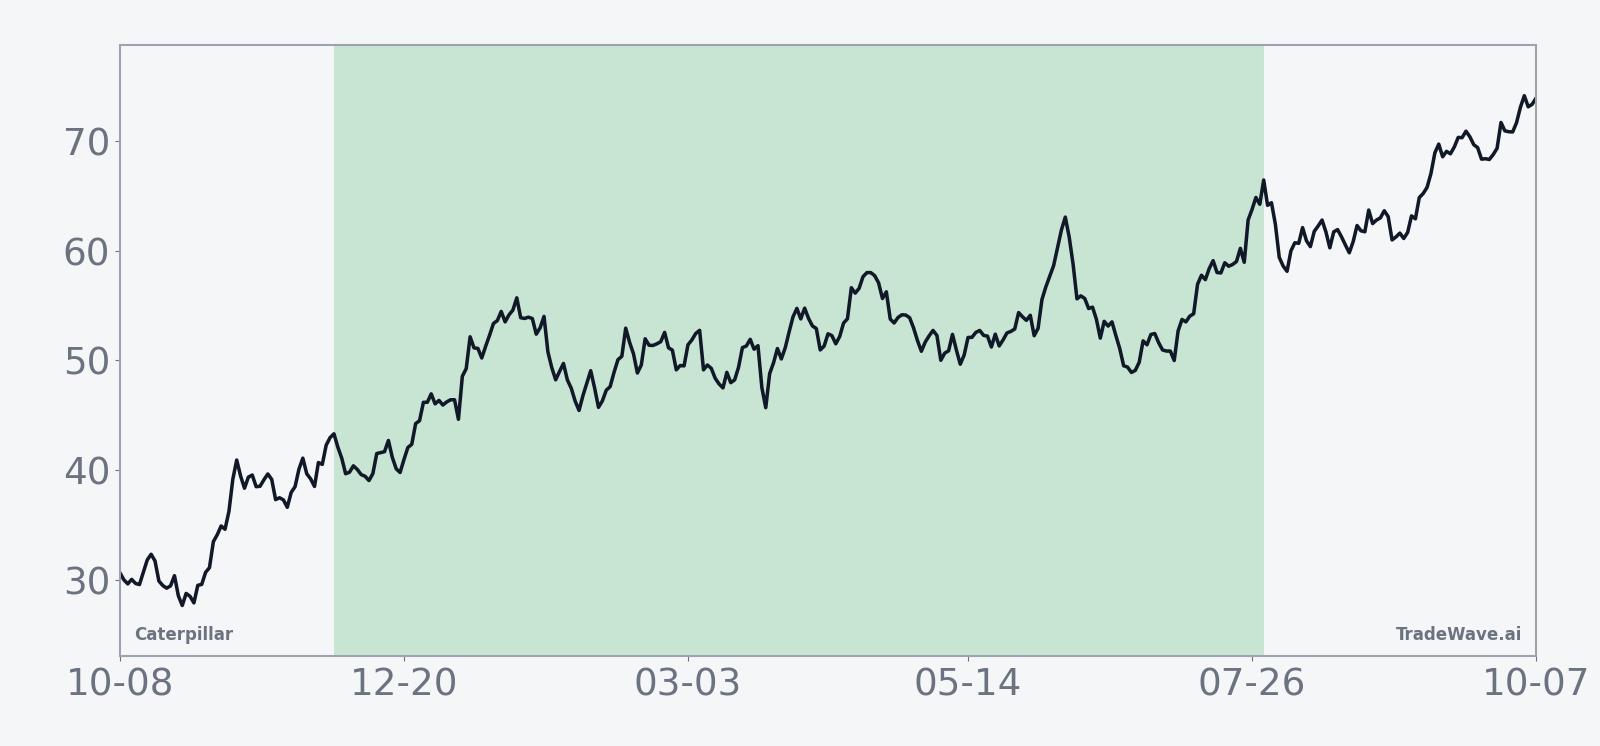
According to historical data from TradeWave.ai, this specific 240-day stretch has shown a persistent seasonal tendency for Caterpillar, and the following section summarizes how that pattern has behaved across the past decade without making any prediction about what comes next.
Seasonal window
This seasonal window is currently underway, spanning 240 trading days, and has historically been a strong stretch for Caterpillar. As of the Dec 3 close, the stock finished at 580.38, about 2.7% below its 52-week high of 596.21 after a modest 0.4% pullback on the day, leaving it close to the top of its recent range.[1][2]
Over the past decade, this long-bias window has produced profitable outcomes in 9 of 10 years, with winning instances averaging a 14.39% gain and the all-years average, including the single losing year, still at 13%. That kind of hit rate and gap between the average winner and the lone loser is also reflected in a Sharpe ratio of 0.79, a risk-adjusted average return measure based on end-of-window outcomes that points to a relatively consistent profile for a cyclical industrial stock.
The per-year pattern shows how that strength has played out in practice. The strongest recent example came in 2023, when the window delivered a 36.92% net gain, with the stock experiencing a maximum favorable move of 50.65% and only a shallow worst drawdown inside the period. By contrast, 2018 stands out as the one losing year, ending down 1.26% and featuring a double-digit adverse excursion, while 2019 managed to close slightly positive despite a maximum adverse move of more than 30%, illustrating how deep drawdowns can still resolve into gains by the end of the window.
Across all years, maximum favorable excursions have often built in the middle part of the window, with several episodes where rallies accelerated after an early consolidation. The maximum adverse moves tend to cluster around macro and policy shocks, but they have not followed a single calendar pattern, which is why the historical record combines a high success rate with a meaningful range of intraperiod swings. The TradeWave Ratio of 1.28 captures this tendency for price to travel a substantial distance in the trade direction inside the window, regardless of where it finishes.
The seasonal trend and cumulative return profiles reinforce that picture. The average path shows gains that build in stages rather than in a straight line, with a tendency for the bulk of net progress to occur after the first quarter of the window. Taken together, the historical pattern defines the quantitative seasonal backdrop for the current period and helps frame how a stock that is already near record highs might behave if past cycles are a guide, without implying that the same outcome will repeat.
Year-by-year net returns and peak excursions show how upside phases have often come with sizable interim drawdowns.
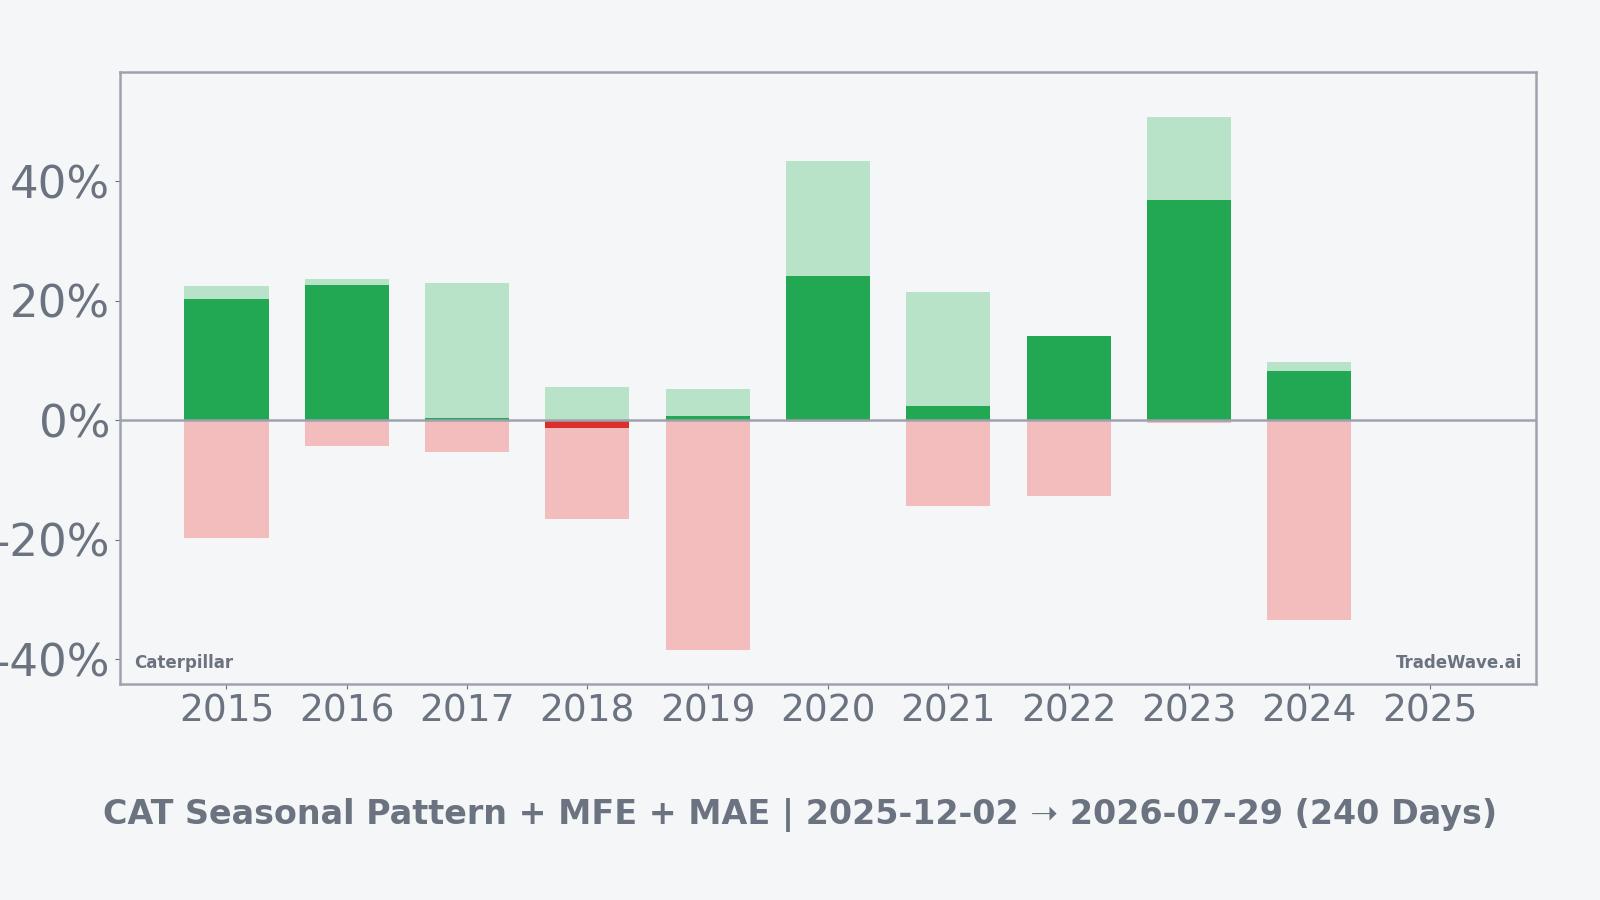
History does not guarantee future results, and adverse excursions (MAE) can be large even in windows that ultimately finish higher.
Price and near-term drivers
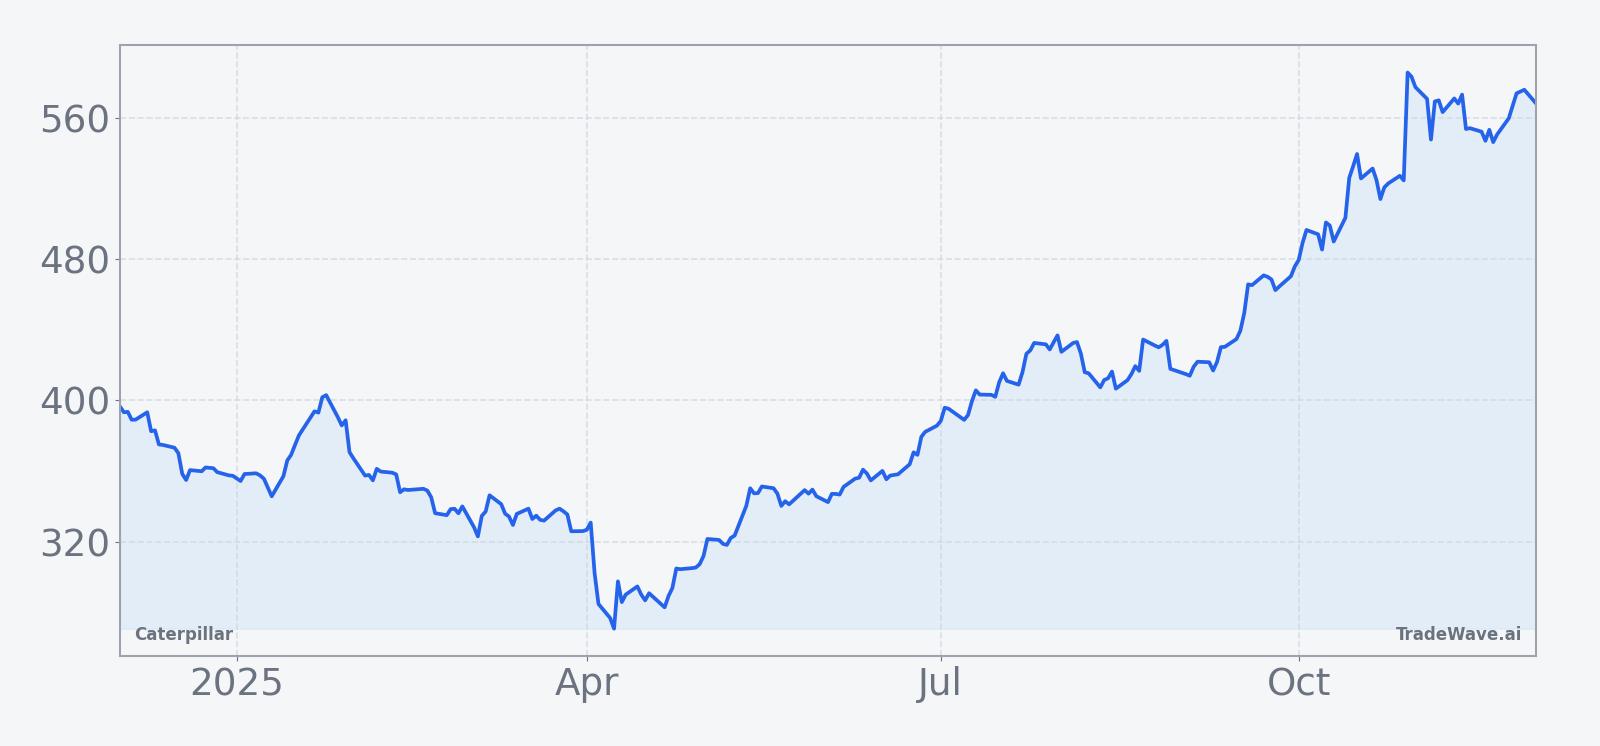
Caterpillar enters this seasonal regime after a powerful run that has taken the shares to 580.38 at the Dec 3 close, down only slightly on the day and leaving the stock roughly 2.7% below its 52-week high of 596.21. Recent data show the stock has more than doubled from its 52-week low of 267.30, and one-year performance has been robust compared with the broader industrials space, underscoring how much enthusiasm is already embedded in the price as this historically strong window unfolds.[1][2][3]
The chart below places this latest move in the context of the past year of trading.
Fundamentally, the story is being pulled in two directions. On the one hand, management has warned that higher trade-related costs could take a cumulative toll of up to 1.5 billion dollars in the second half of 2025 as tariffs bite and machinery pricing softens in some categories, introducing margin risk just as the stock trades at a premium valuation.[12] On the other hand, demand for backup power and turbines tied to AI data centers has become an increasingly important growth driver, offsetting some softness in more traditional construction cycles as hyperscale customers expand their infrastructure footprints.[12]
Longer term, Caterpillar used its recent investor and analyst event to outline 2030 targets that include average annual sales growth of about 6% and a potential operating margin improvement from a 2019 to 2024 average of 16% to as high as 25% if revenues reach 100 billion dollars.[6][7] That strategy leans heavily on continued strength in mining, construction and energy, as well as higher value service and technology layers, and has contributed to a sharp improvement in sentiment, with the stock up more than 50% year to date and roughly 70% over the past six months heading into December.[5][7]
There is also a new legal overhang. On Dec 2, Bobcat filed lawsuits in a Texas federal court and with the U.S. International Trade Commission alleging that Caterpillar equipment infringes patents tied to compact machinery and machine control technology, and it is seeking both monetary damages and a potential import ban on certain models.[8] The company has not yet publicly detailed its response, but investors will be watching how the case progresses and whether it poses any risk to key product lines in North America and Europe.
On the calendar front, the next major checkpoint is earnings. Multiple tracking services show Caterpillar scheduled to report its next set of quarterly results around Jan 29, 2026, before the market open, which will give investors an updated read on margins, order trends and backlog as the seasonal window advances into its early stages.[4] Street expectations currently look for solid, if more measured, earnings growth after a strong 2024 and 2025, and any deviation from that path could shift how investors treat the historical pattern.
Valuation and income are important context as well. Recent data put the trailing price to earnings ratio near 30 times, well above the company’s average over the past several years and at a premium to many industrial peers, reflecting optimism about sustained growth and higher profitability through the decade.[10] At the same time, Caterpillar continues to return cash through dividends, with a forward yield a little above 1% and a payout ratio under 30%, backed by a board decision in October to maintain the quarterly dividend at 1.51 dollars per share.[9]
Analyst views are broadly constructive but not euphoric given the recent rally. A recent compilation of Wall Street forecasts shows an average 12-month price target around 600 to 610 dollars, implying only modest upside from current levels after the stock’s strong advance, even though the highest individual targets stretch to 730 dollars per share.[11] That mix of a positive long-term narrative, relatively full valuation and only incremental target upside makes the interaction between this seasonal window and the company’s execution on earnings and capital allocation particularly relevant.
What to watch
For traders and longer term investors, the key question is not whether the past decade’s seasonal pattern will repeat, but how current fundamentals align with that historical backdrop. The window that began on Dec 2 has been associated with a high share of positive outcomes and sizeable maximum favorable excursions, yet it has also featured episodes of deep drawdowns inside the period. In the months ahead, the market’s reaction to the Jan 29 earnings report, any updates on tariff costs, the trajectory of AI data center related orders and developments in the Bobcat patent case will help determine whether price action inside this window looks more like the strong years or the outlier down year. Watching how the stock trades around its recent highs, how quickly it absorbs any negative headlines and whether volumes build on up days rather than on pullbacks will be important clues as to whether the seasonal tendency toward strength is being confirmed or challenged in this cycle.[4][7][8][12]
Sources
- StockAnalysis.com - Caterpillar (CAT) daily price history and recent closes
- Caterpillar Investor Relations - Stock trade history and 52-week range
- Investing.com - Caterpillar historical performance and 52-week range
- MarketBeat - Caterpillar upcoming earnings date and resources
- Caterpillar Investor Relations - Company overview and business profile
- Caterpillar Investor Relations - 2025 Investor Day and long-term targets
- Barron's - Caterpillar stock is up as Wall Street turns more optimistic
- Reuters - Bobcat sues Caterpillar over construction equipment patents
- Yahoo Finance - Caterpillar key statistics and dividend metrics
- Wisesheets - Caterpillar current P/E ratio and comparison to recent averages
- TipRanks - Caterpillar analyst ratings and 12-month price targets
- Manufacturing Dive - Caterpillar warns of tariff hit as AI data center demand grows