Visa (V) trades inside a historically strong seasonal window into 2026
Visa is consolidating below its record highs after strong fiscal 2025 results and a dividend hike, just as a historically strong multi-month seasonal window gets under way into 2026.

Key takeaways
- Visa is already in a 188-trading-day seasonal window that has been historically strong over the past decade, with all 10 prior instances finishing in positive territory.
- The pattern has been a long-direction setup, with Percent Profitable at 100% across 10 winners and 0 losers and an average gain of 13.15% over the window, supported by a Sharpe ratio of 1.33.
- Intraperiod behavior has featured sizable swings: some years saw maximum favorable moves above 25%, while others experienced mid-teens drawdowns before recovering into gains.
- The historical seasonal trend has tended to build gradually, with gains often compounding from early in the window through late spring before flattening out.
- Today, Visa shares sit below their 52-week high but remain supported by solid fiscal 2025 earnings, a higher dividend, and resilient consumer spending.
- History suggests opportunity for further upside within this window, but past episodes show that drawdowns can arrive quickly even in years that ultimately finish higher.
According to historical data from TradeWave.ai, this stretch of the calendar has displayed a distinct long-biased pattern for Visa in prior years, providing a quantitative backdrop to the current price action.
Seasonal window
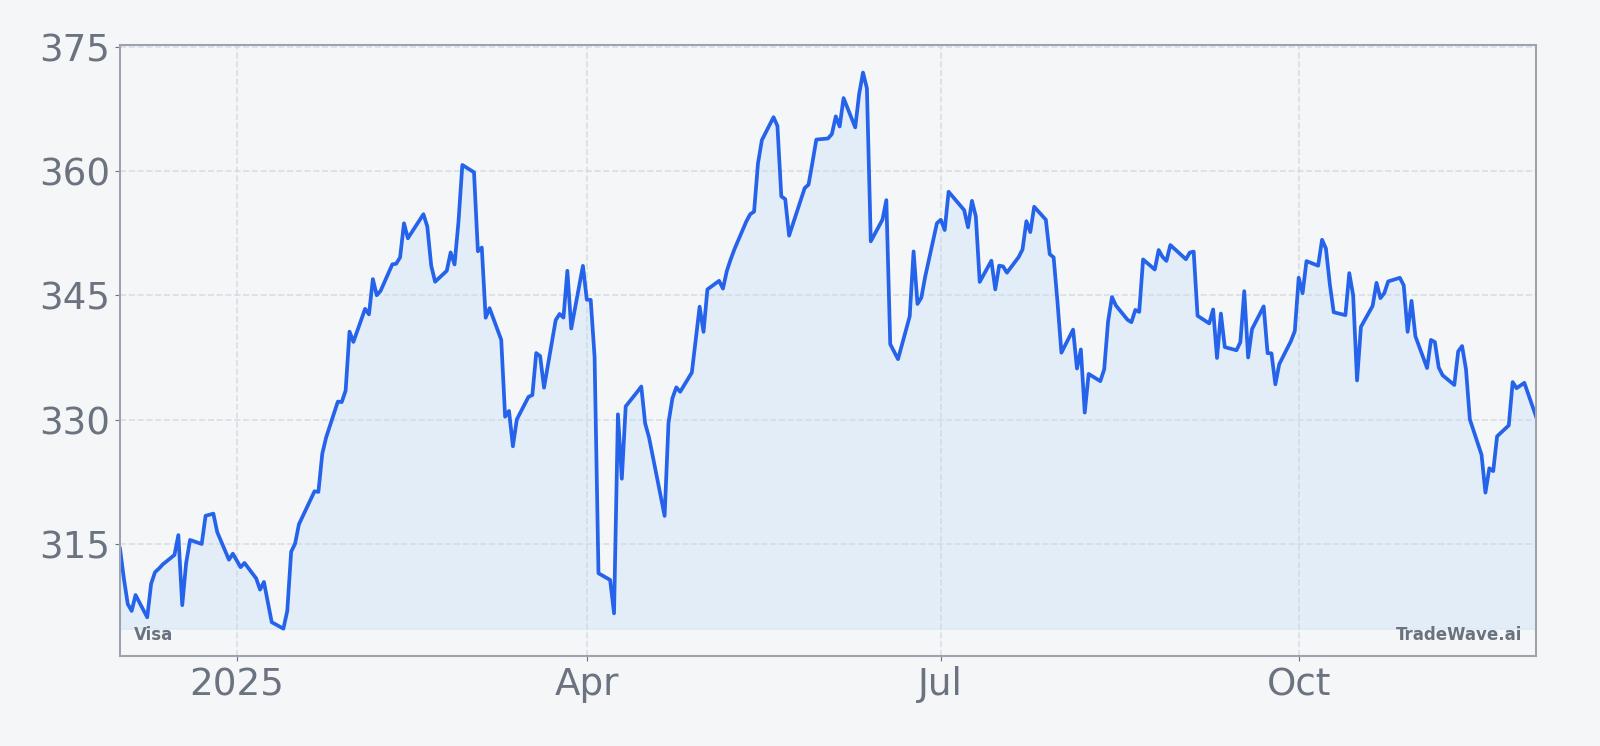
This seasonal window is currently underway, spanning 188 trading days beginning on Dec 2, 2025, and has historically been a strong stretch for Visa. As of the most recent close, the stock trades around $329, leaving it about 12.2% below its 52-week high near $375 and consolidating after a run toward record levels earlier in the year.[1]
Over the 10-year lookback, every instance of this Visa pattern has ended with a gain, with Percent Profitable at 100% on 10 winners and 0 losers and an average profit of 13.15% across the window, alongside a median gain of 10.26% and cumulative return of 235%. The setup is firmly aligned with a long trade direction, and the combination of a 1.33 Sharpe ratio and a TradeWave Ratio of 1.96 points to historically attractive risk-adjusted returns and meaningful travel in the trade direction within the window.
The per-year history shows that strength has come with volatility. In stronger episodes such as 2016 and 2017, Visa logged net returns of 27.37% and 25.0%, with maximum favorable moves of 28.04% and 27.56% and relatively shallow worst drawdowns. In contrast, years like 2015, 2018, and 2019 still finished positive but saw maximum adverse excursions ranging from the mid-teens to more than 26%, underscoring that investors had to tolerate sizable pullbacks before the pattern played out.
On average, the seasonal trend line for this window slopes steadily higher, with gains tending to build as the window progresses, rather than relying on a single short burst of performance. The cumulative return profile clusters around that upward path, reflecting the absence of losing years but also highlighting that some cycles delivered outsize gains while others tracked closer to the median outcome.
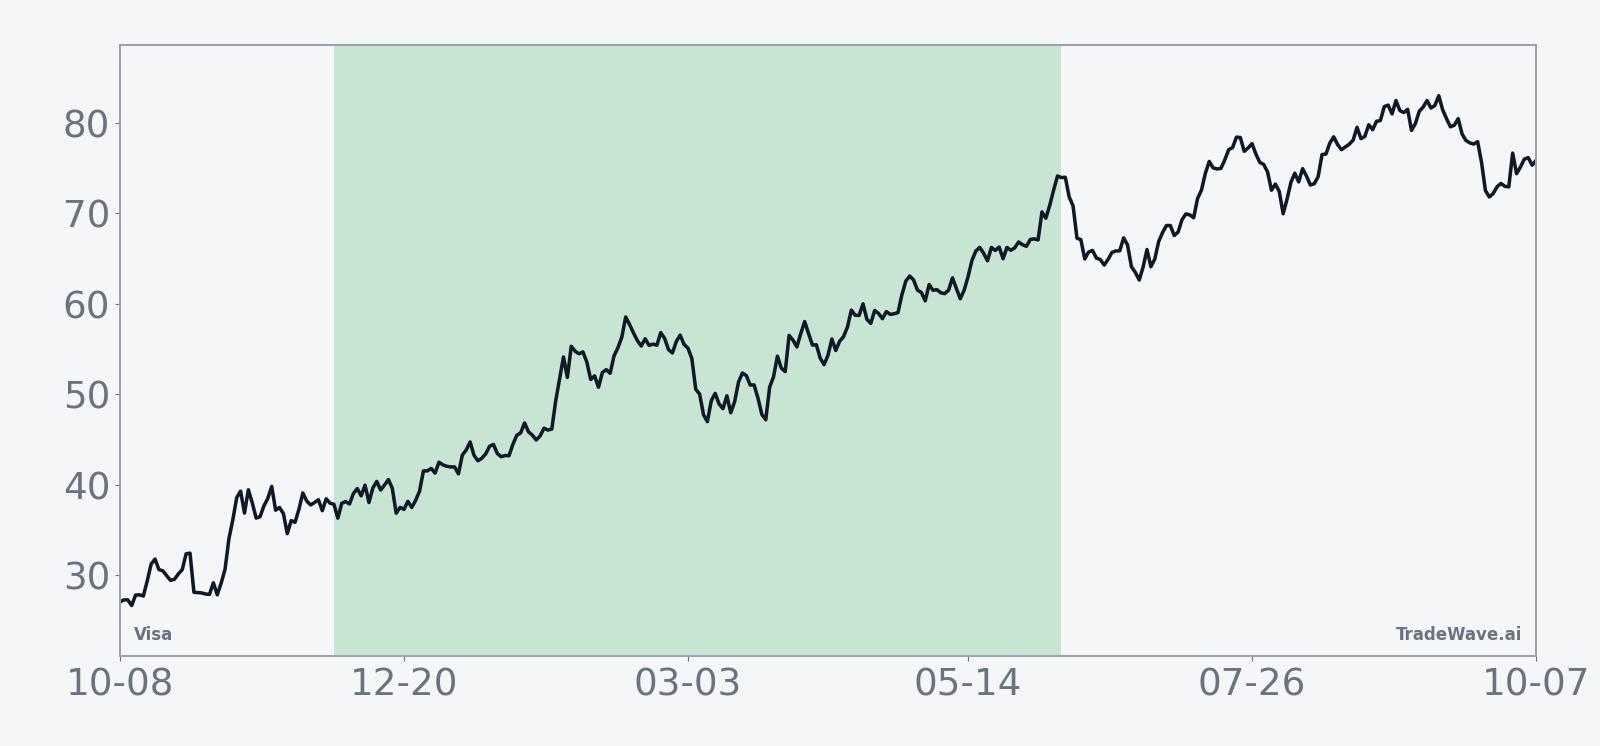
Year-by-year net returns and intraperiod excursions illustrate how often Visa has rallied within the window while still experiencing notable drawdowns along the way.
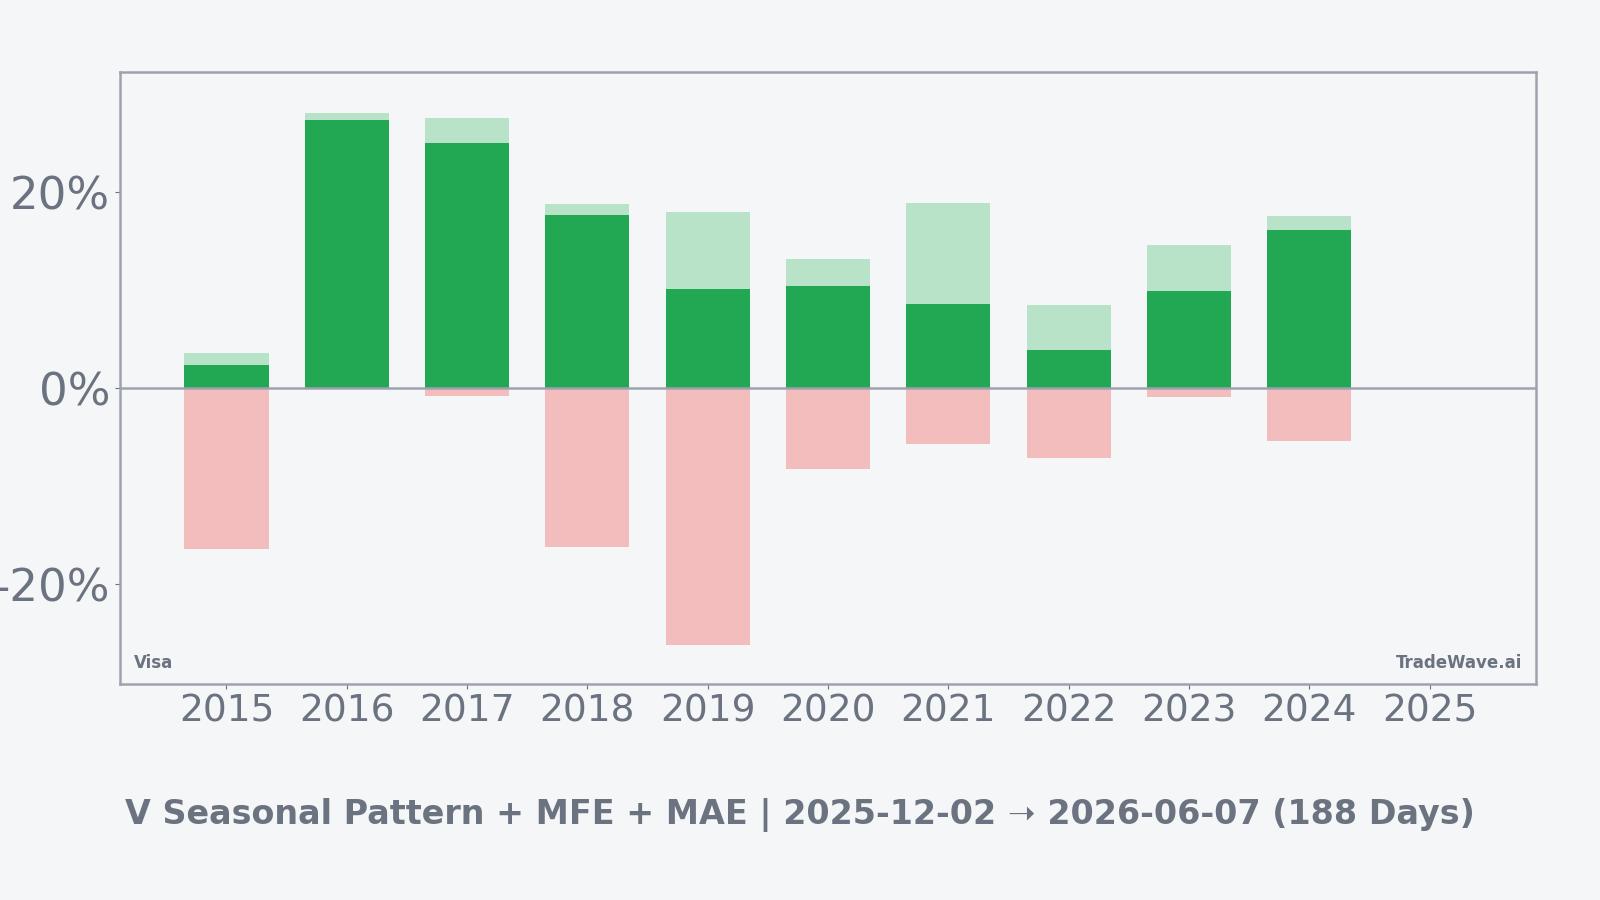
In the more favorable years, maximum favorable excursions have often climbed well beyond the final net return, signaling that rallies tended to overshoot before settling back toward the close, while maximum adverse excursions show that even winning years could involve double-digit pullbacks at some point in the window. Taken together, the historical pattern defines the quantitative seasonal backdrop for the current period.
History does not guarantee future results, and even in a window that has always finished higher in the past, adverse excursions can be large before any upside ultimately develops.
Price and near-term drivers
Visa shares have been drifting slightly lower from recent peaks, with the stock edging down over the past few sessions after touching levels in the mid-$330s in late November and early December as investors digested a strong fiscal 2025 earnings season and year-end positioning flows.[2]
The chart below situates the latest consolidation in the context of the stock’s broader advance over the past year.
In late October, Visa reported fiscal fourth quarter results that topped consensus expectations, with net revenue rising around the low teens year over year and adjusted earnings per share coming in slightly ahead of forecasts, helped by solid growth in payments volume and steady cross-border activity.[3]
The company’s own release highlighted broad-based strength across consumer spending categories, with double-digit constant-currency growth in payments volume and continued recovery in travel-related transactions as cross-border volumes expanded from already elevated levels.[4]
Earnings and capital returns
Alongside its fiscal fourth quarter earnings release, Visa’s board approved an increase in the quarterly cash dividend to $0.67 per share of class A common stock, payable on Dec 1, 2025, and also continued to deploy capital through sizable share repurchases funded out of robust free cash flow.[5]
The higher dividend represents a mid-teens percentage increase versus the prior payout, extending a long-running record of annual dividend growth that has become a central part of Visa’s shareholder-return story.[6]
Looking ahead, several calendar-based earnings trackers currently estimate that Visa’s next earnings report will fall in the second half of January 2026, keeping the company’s fiscal first quarter update squarely inside the early portion of the current seasonal window.[7]
Macro backdrop and payments trends
Visa’s recent earnings reports have emphasized that consumer spending remains resilient across both discretionary and non-discretionary categories, with payments volume and processed transactions growing in the high single to low double digits despite mixed macro headlines.[8]
At the same time, Visa continues to push into newer payment rails, including expanding its stablecoin settlement capabilities and working with partners to support more digital wallet and cross-border payout use cases, positioning the network to benefit from structural shifts in how money moves across borders.[9]
Valuation snapshot
On current estimates, Visa trades at a trailing price-to-earnings multiple in the low 30s, with a dividend yield just under 1%, placing the stock at a premium to broad market averages but broadly in line with its own recent history and with other high-quality global payment networks.[10]
What to watch in this window
For traders and longer-term investors, the key question is whether Visa’s price action over the next several months continues to resemble the historical pattern of steady, if sometimes choppy, upside across this 188-day window or instead diverges meaningfully from that track. Sustained strength on earnings updates early in 2026, accompanied by healthy payments volume and cross-border trends, would be consistent with the long-biased seasonal tendency that has dominated the past decade.
Volatility inside the window will matter as much as direction. Past episodes show that even winning years have seen sizable drawdowns at some stage, so any sharp pullback from current levels will be worth watching in the context of the historical maximum adverse excursions highlighted by the seasonal statistics. A recovery from such setbacks back into an upward trajectory would fit the established pattern; an extended break lower that fails to regain momentum would represent a clearer departure.
Investors will also be monitoring how Visa executes on its capital-return plans and innovation roadmap as the seasonal regime unfolds. Delivery on earnings expectations, progress in newer areas such as stablecoin-enabled settlement and real-time payouts, and the stock’s behavior around prior high zones and recent consolidation ranges will help determine whether this historically strong window again proves supportive for Visa or whether 2025–26 becomes one of the more atypical years in the data set.
Sources
- Yahoo Finance - Visa Inc. (V) Stock Price, News, Quote & History
- StockAnalysis - Visa Inc. (V) stock price history
- Reuters - Visa quarterly profit rises on strong transaction volumes
- Visa Investor Relations - Fiscal Fourth Quarter and Full-Year 2025 Financial Results
- SEC - Visa Inc. fiscal Q4 2025 earnings release (Exhibit 99.1)
- Yahoo Finance - Visa (NYSE: V) is increasing its dividend to $0.67
- MarketBeat - Visa (V) earnings date and reports
- MarketWatch - Visa says spending is growing at a healthy rate, but its stock dips after earnings
- Visa Investor Relations - Visa expands stablecoin settlement support
- Fullratio - Visa Inc. (V) valuation metrics and ratios