Microsoft (MSFT) enters a historically strong seasonal window today
Microsoft shares have pulled back from record highs just as a powerful 254 day seasonal window begins, putting the stock’s AI driven growth story and fresh insider selling into sharper focus.

Key takeaways
- Microsoft has just entered a 254 day seasonal window starting Dec 3 that has historically been a strong long biased stretch for the stock over the past 10 years.
- Across that sample, the pattern has been profitable in 90% of years, with 9 winners and 1 loser, and winning years have averaged a 25.96% gain versus a 22% average when all years are included.
- The weakest year in the window, 2021, still saw a maximum favorable move of 6.59% but suffered a maximum adverse excursion of 24.9%, highlighting the potential for deep drawdowns even when the long term record is strong.
- Recent price action shows Microsoft about 13.0% below its 52 week high after a pullback from record levels near $555, leaving the stock in consolidation territory rather than at extremes as the window begins.[1][2]
- A recent Form 4 filing revealed that Vice Chair and President Brad Smith sold roughly $20 million of stock near $518 in early November, adding an additional layer of signal to watch during this regime.[3]
- For investors who track seasonality, this window defines a quantitative backdrop rather than a guarantee, and history suggests both meaningful upside potential and pockets of elevated volatility inside the path.
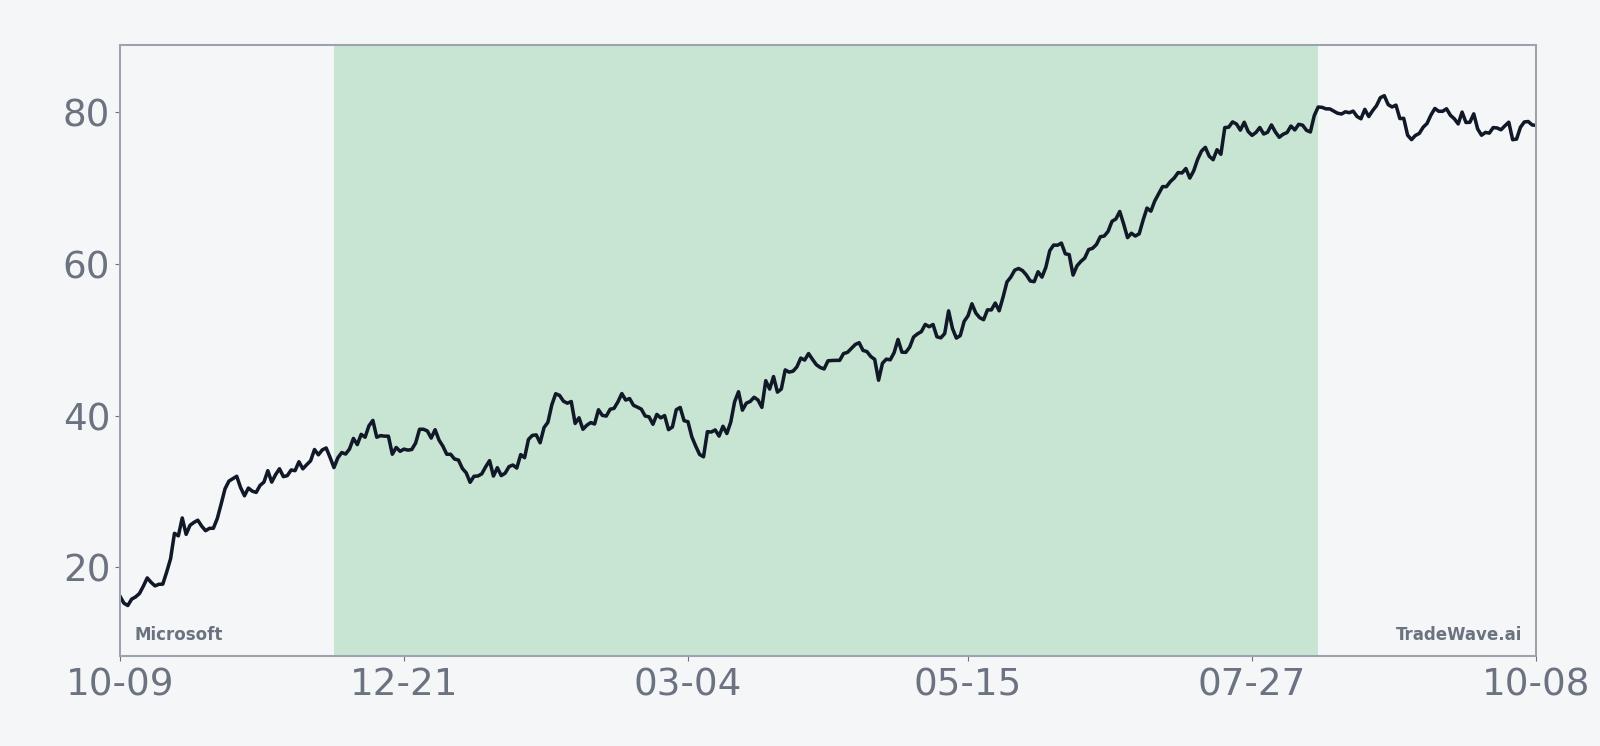
According to historical data from TradeWave.ai, this long dated window for Microsoft has shown a distinct upside tendency in prior cycles, with a clear pattern of strong full period outcomes accompanied by sizable intraperiod swings.
Seasonal window
This seasonal window begins on 2025-12-03 and spans 254 days. Historically, during this period, Microsoft has shown a strong upside bias in its long direction. On Dec 3, 2025, the stock closed near $483, down about 1.3% on the day and roughly 13.0% below its recent 52 week high around $555, leaving room above if the pattern repeats.[1][2] A notable counterpoint is a recent Form 4 filing showing Vice Chair and President Brad Smith selling about $20 million of stock near $518 in early November, a sizable insider sale that came as investors reassessed Microsoft’s heavy AI capital spending.[3]
Across the past decade, this long pattern has produced nine positive outcomes and only one losing year, with winning windows averaging a 25.96% gain and the all years average, including the single down year, still a robust 22%. The lone loss came in 2021, when the net return for the window was about minus 8.75%, highlighting that even in an otherwise favorable regime, individual years can deviate sharply from the historical tendency.
The per year profile shows that maximum favorable excursions, the best peak run-ups during the window, have often pushed into the high 20% to mid 40% range, with the strongest upside year, 2022, recording a maximum favorable move of roughly 47.28%. On the downside, maximum adverse excursions, the worst drawdowns from the entry point, have in several years run into the mid teens or deeper, including a 24.9% intraperiod drawdown during the 2021 loss and almost 20% in 2024, even though those years eventually finished the window with much smaller or even positive net results.
That combination of strong average gains, a 90% hit rate, and sizable maximum adverse excursions points to a window where the dominant historical tendency has been upward, but where volatility within the path has mattered. The TradeWave Ratio of 1.94 indicates that, in typical years, price has tended to travel substantially in the long direction inside the window, even if not all of that move is retained by the end.
Yearly net and peak moves highlight how historically strong full period gains have coexisted with meaningful intraperiod swings.
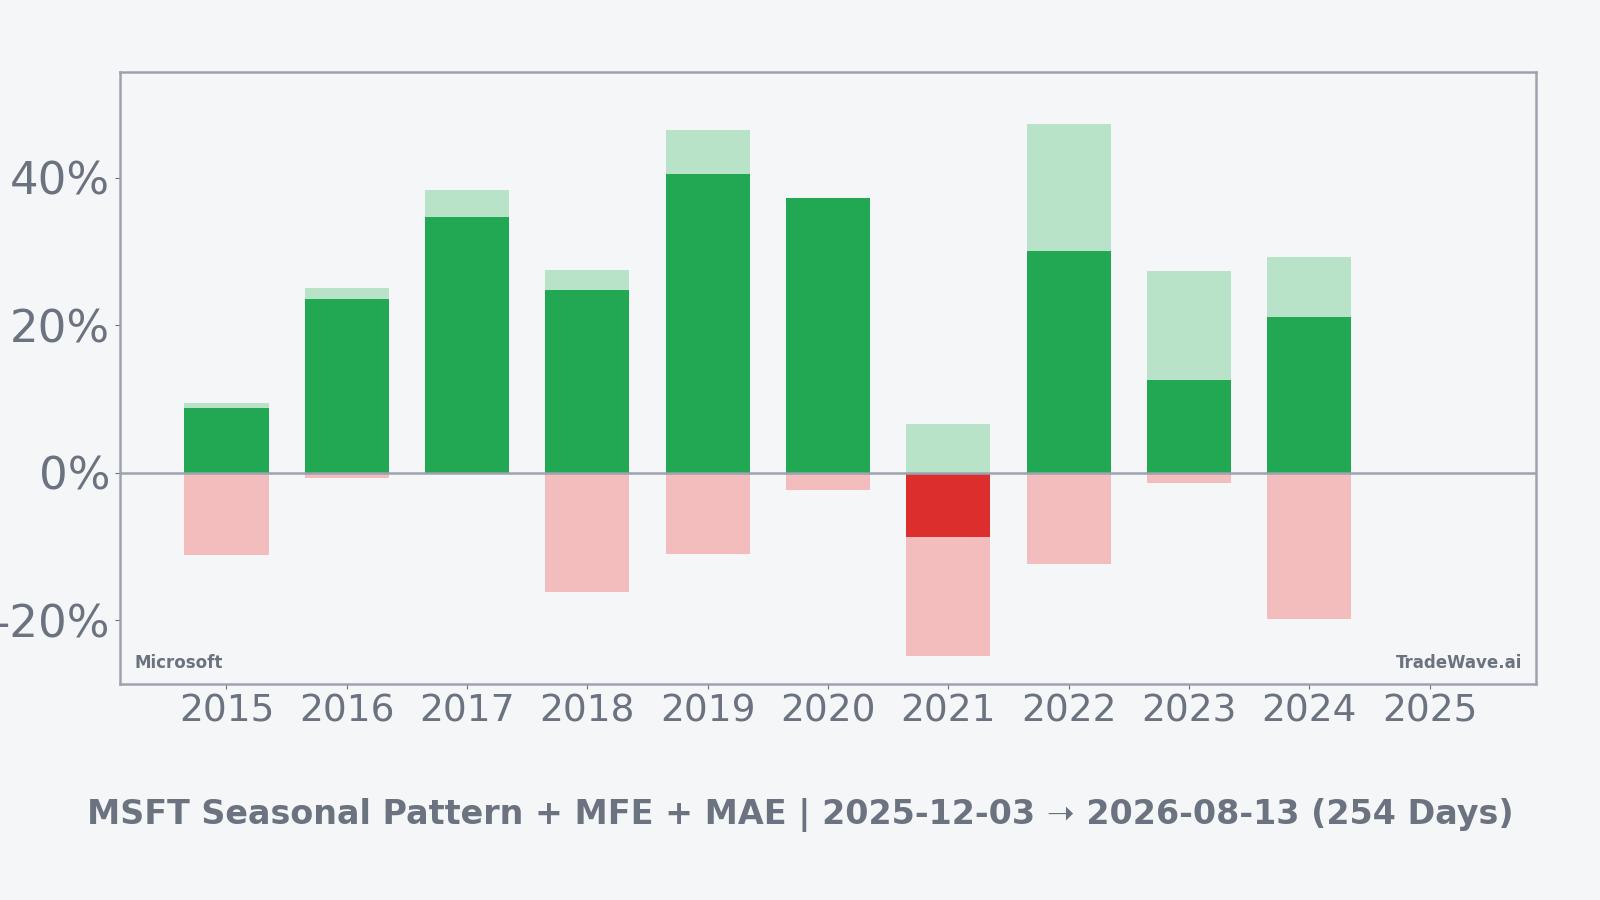
Viewed together, the seasonal trend and the bars with maximum favorable and adverse excursions suggest that strong years often see upside build over much of the window, while the worst setbacks have tended to cluster in a handful of episodes rather than every year. Taken together, the historical pattern defines the quantitative seasonal backdrop for the current period.
History does not guarantee future results, and adverse excursions (MAE) can be large even in winning windows.
Price and near-term drivers
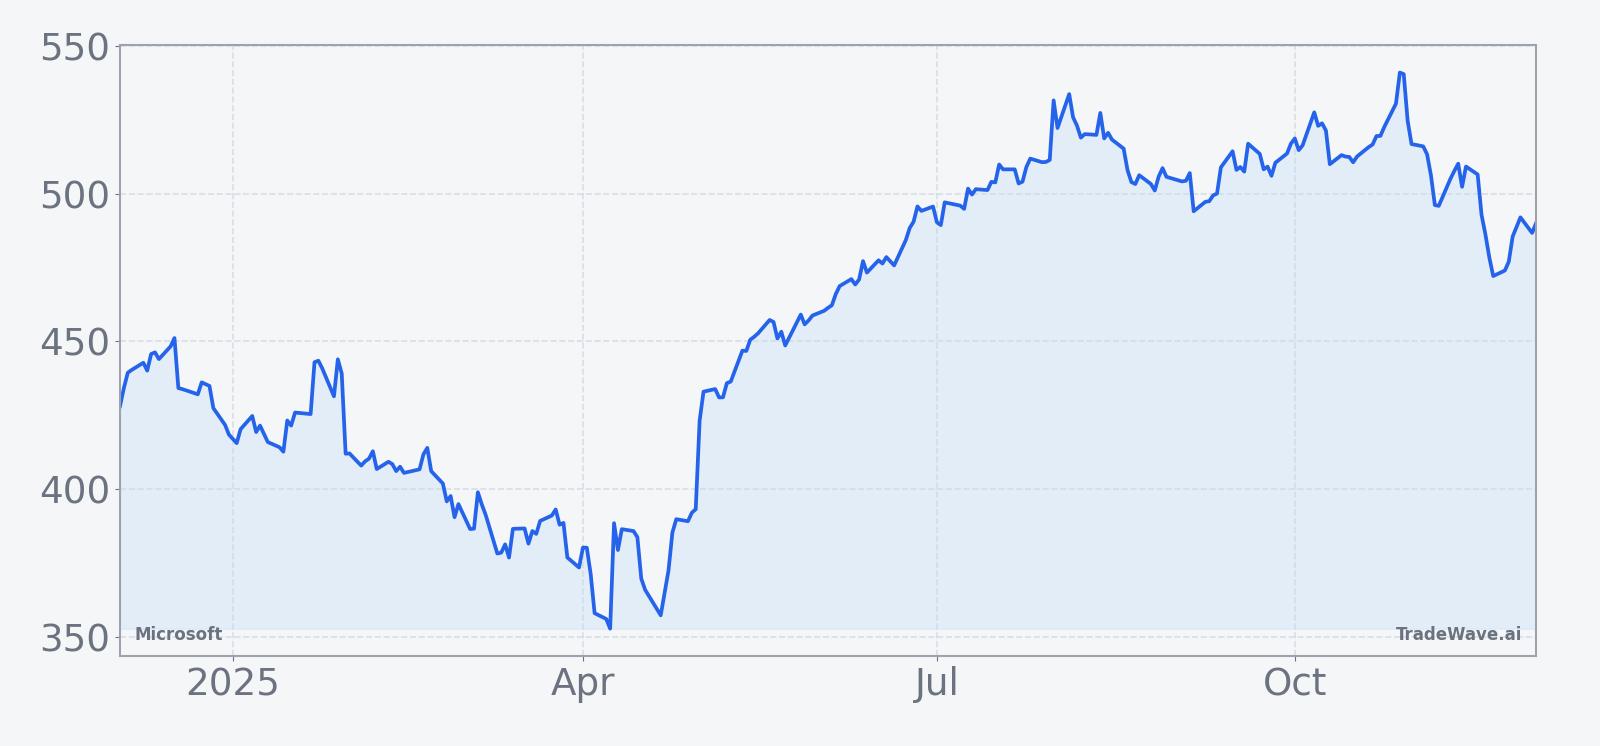
Microsoft shares have been retracing from record territory after a long AI fueled rally, with the stock recently trading in the high $480s and giving back part of this year’s gains following its latest fiscal 2026 first quarter report.[1][4] The earnings release on Oct 29 showed revenue rising 18% year on year to $77.7 billion and net income up 12% to $27.7 billion, driven largely by Azure and other cloud services, but it also highlighted capital expenditures of $34.9 billion tied to AI infrastructure that surpassed expectations and sparked debate about spending intensity.[4][10] More recently, broader pressure on megacap tech from tighter United States export controls on advanced AI chips has weighed on sentiment across the group, adding another macro headwind around the time this long seasonal window begins.[5]
The chart below situates the latest pullback in the context of Microsoft’s past year of trading.
Earnings outlook
In fiscal 2026’s first quarter, Microsoft delivered another set of double digit growth numbers, with revenue of $77.7 billion up 18% year over year and operating income rising 24%, as cloud and AI workloads continued to power the business.[4][10] Azure and other cloud services grew around 40% in the period, and total cloud revenue reached roughly $49.1 billion, underscoring how central the cloud platform has become to the company’s overall growth algorithm.[10] Productivity and business processes also contributed strongly, helping offset ongoing weakness in more cyclical devices and gaming hardware lines.
Looking ahead, third party calendars currently point to a late January to early February window for the next earnings report, though exact timing has not yet been formally set by Microsoft’s investor relations team.[7] ValueSense estimates the next earnings date as Jan 27, 2026, while Zacks places the expected release on Feb 4, 2026, highlighting a narrow range of projections that still clusters around the typical late January earnings slot.[8][9] Street expectations call for continued double digit earnings growth into fiscal 2026, supported by AI driven demand for Azure and ongoing operating leverage in cloud and software subscriptions.[6][8]
Macro and sector context
Microsoft remains one of the market’s key bellwethers, recently joining the small group of companies that have reached a market value of around $4 trillion on the back of its AI led cloud story.[6] Analysts have consistently highlighted the company as a core member of the so called Magnificent Seven, arguing that its combination of hyperscale cloud, enterprise software and AI tooling leaves it uniquely positioned as corporate customers look to modernize infrastructure.[6] At the same time, investors are paying close attention to the incremental macro sensitivity in areas like PCs, advertising and gaming, which have historically been more exposed to cyclical slowdowns.
The latest quarter underscored that mix of strengths and challenges. Xbox hardware revenue fell sharply again, with Microsoft disclosing a 29% year on year decline and signaling that hardware is likely to remain a drag as the company shifts toward an “Xbox everywhere” strategy focused on services and content.[10] Windows OEM and devices revenue, by contrast, showed modest growth of around 6%, while Azure and other cloud services once again delivered the bulk of incremental revenue, with Azure’s growth rate more than double that of many peers.[4][10] For the seasonal window now underway, that backdrop means Microsoft enters with strong secular tailwinds but also visible pockets of cyclical and competitive risk.
Valuation and positioning
After its long advance and recent pullback, Microsoft still trades at a premium valuation relative to the broader software and market indices. ValueSense data show the shares changing hands at a price earnings multiple in the mid 30s, above both the industry median and the company’s own historical median, even after the stock has backed off record highs.[8] That elevated multiple is underpinned by robust earnings growth, with the same data set pointing to mid teens to high teens earnings expansion over the coming years as cloud and AI monetization deepen.[6][8]
Analyst positioning remains firmly constructive. Investors Business Daily reports that all of the 61 analysts tracked by FactSet currently rate the stock a buy, with several major firms recently lifting price targets into the high $500s and low $600s on the view that AI infrastructure demand will support sustained revenue beats.[6] At the same time, insider trading data show that Bradford Smith’s November share sale was part of a broader pattern of net insider selling over the past year, with no corresponding insider purchases, a factor that some investors view as a modest caution signal even as executives retain large residual stakes.[3][11]
What to watch during this window
For traders and long term holders, the key seasonal takeaway is that Microsoft’s Dec 3 start window has historically favored the long side, with a 90% win rate and strong average gains, but also episodes of deep intraperiod drawdowns. That profile suggests that the most interesting signals during this stretch may not come from the eventual end point alone, but from how the stock behaves as it works through bouts of volatility and tests support or resistance inside the path.
Fundamentally, the next earnings report in late January or early February will be a central waypoint, offering a fresh look at Azure momentum, AI related capital expenditures and management’s commentary on returns from the current investment cycle.[4][8][9] Investors will also be watching how the stock responds to ongoing macro headlines around AI chip export controls, broader tech regulation and demand for enterprise cloud transitions, all of which have been important drivers of sentiment in recent weeks.[5][6]
The recent insider sale by Microsoft’s Vice Chair and President adds another datapoint to monitor as the seasonal window plays out. If additional Form 4 filings show continued selling from top executives at similar or lower prices, some investors may view that as a sign that leadership is content to trim exposure as AI spending peaks, while a lack of follow through could indicate that the early November transaction was largely about diversification rather than a view on near term performance.[3][11] In either case, combining that insider context with the long term seasonal pattern and the company’s fundamental trajectory can help frame risk and opportunity more systematically as this historically strong window unfolds.
Sources
- Investing.com - Microsoft Corporation historical data and recent daily prices
- Barchart - Microsoft (MSFT) stock overview and 52 week range
- Barron’s - Microsoft President Sold $20 Million in Shares After Post-Earnings Stock Slide
- Microsoft Investor Relations - Fiscal Year 2026 Q1 earnings press release
- Reuters - Microsoft and peers slide as new US curbs hit AI chip sentiment
- Investor’s Business Daily - Microsoft stock rises on AI cloud power; analysts bullish
- Microsoft Investor Relations - Events and earnings call calendar
- ValueSense - Microsoft Corporation earnings dates, results and valuation metrics
- Zacks - Microsoft Corporation earnings calendar and EPS estimates
- The Verge - Xbox hardware sales continue to tank as cloud and AI drive Microsoft
- Simply Wall St - Have insiders sold Microsoft shares recently