KLA Corporation (KLAC) trades inside a historically strong seasonal window
KLA Corporation is riding a powerful AI-driven uptrend as it moves through a historically strong 244-day seasonal stretch, putting fresh focus on how long earnings momentum and sector tailwinds can keep the rally going.
Key takeaways
- KLA Corporation is in a 244-day seasonal window that has historically been strongly positive for long positions, with 9 winning years and 1 losing year over the past decade.
- Across those years, 90% of outcomes were profitable, with average gains of 27.81% in winning seasons and 25% when all years are included.
- The pattern aligns with a powerful fundamental backdrop, including a roughly 76% YTD gain in 2025 and strong demand from AI and high-performance computing customers.[2][3]
- Historical maximum favorable moves have often been large, but adverse excursions within the window have at times exceeded 20%, underscoring meaningful drawdown risk even in strong years.
- A TradeWave Ratio of 2.02 and a Sharpe ratio of 1.93 highlight a historically robust risk-adjusted profile for this seasonal regime.
Price and near-term drivers
KLA Corporation is trading near record territory after a roughly 76% gain so far in 2025, putting it among the strongest performers in the semiconductor equipment group as investors crowd into AI and high-performance computing exposure.[2][3] The stock’s surge has been fueled by a combination of better-than-expected earnings, upbeat guidance and a sector backdrop in which chipmakers are racing to add capacity for advanced nodes and packaging.
The chart below situates the latest move in its recent multi-month context.
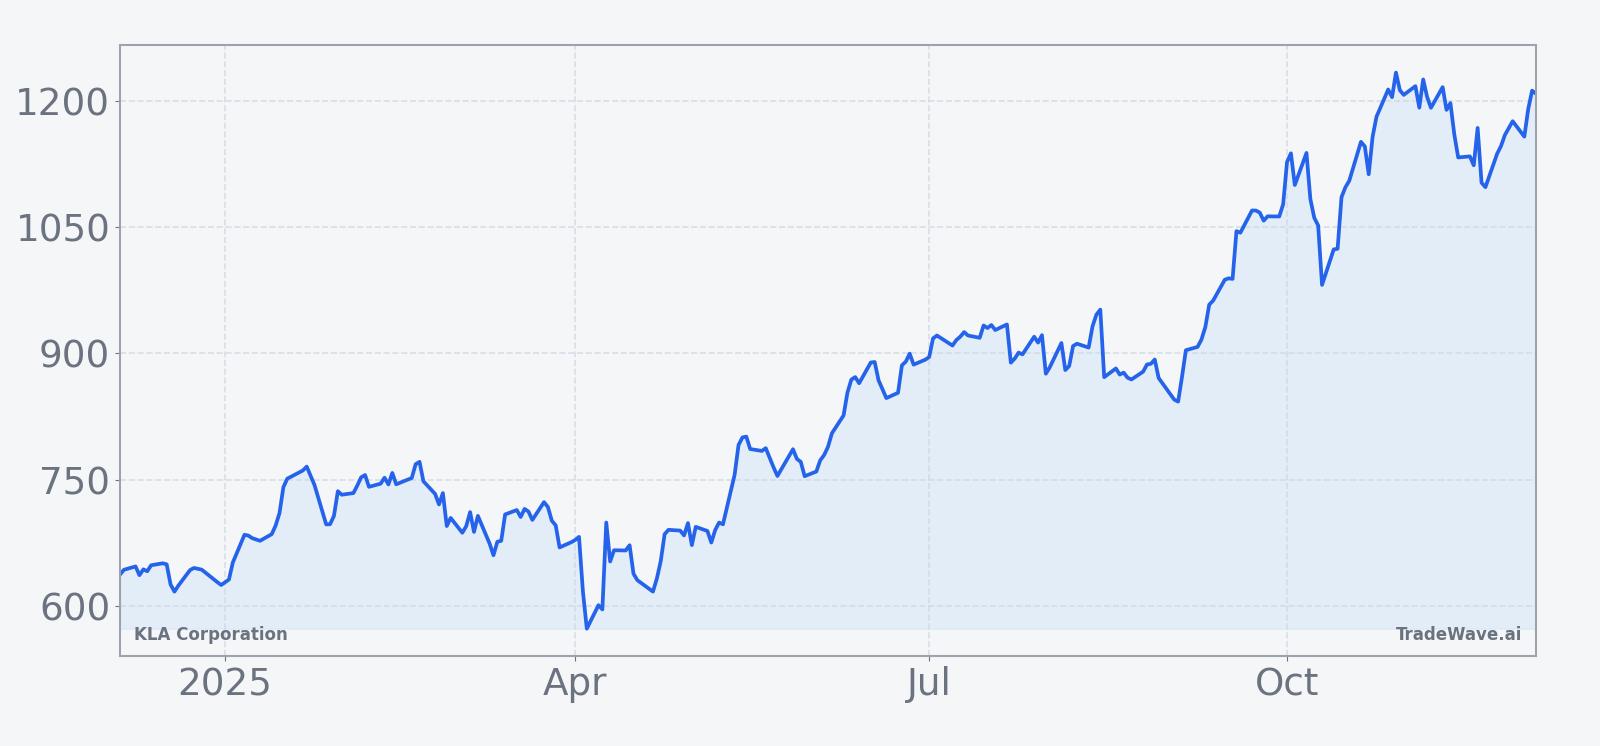
On the fundamental side, KLA’s most recent results showed Q1 fiscal 2026 earnings and revenue ahead of expectations, extending a run of strong quarters that included Q4 fiscal 2025 revenue of $3.175 billion and non-GAAP EPS of $9.38.[2] Management paired those numbers with optimistic guidance for Q2 fiscal 2026, signaling confidence that demand from foundry and logic customers will remain firm into next year.[2]
Industry dynamics have been equally supportive. Analysts and strategists point to an “unquenchable” wave of investment tied to AI and high-performance computing, which is driving a broad upcycle in wafer fab equipment and process control tools where KLA is a key supplier.[3] Forecasts for global semiconductor equipment sales call for a rise to about $125.5 billion in 2025, a 7.4% increase that provides a rising tide for leading vendors.[3]
Earnings and guidance snapshot
KLA’s recent earnings cadence has reinforced the bullish narrative around the stock. In Q1 fiscal 2026, the company exceeded both EPS and revenue predictions, extending momentum from Q4 fiscal 2025 when it delivered $3.175 billion in revenue and non-GAAP EPS of $9.38.[2] The beat-and-raise pattern has helped justify the stock’s sharp move higher this year and underpinned investor confidence that the current demand cycle has room to run.
Looking ahead, KLA has issued optimistic guidance for Q2 fiscal 2026, pointing to continued strength in process control and inspection tools as customers ramp advanced nodes and packaging technologies.[2] While the exact date of the next earnings release has not been specified, the upcoming report will be closely watched for signs that AI-related orders remain resilient and that any cyclical softness in legacy nodes is manageable.
Macro and sector backdrop
The macro story around KLA is tightly linked to the AI and high-performance computing boom. Chipmakers are investing heavily in cutting-edge fabs and advanced packaging lines to support data center accelerators and high-bandwidth memory, which in turn drives demand for KLA’s process control solutions across both front-end and back-end manufacturing.[3]
Sector forecasts reflect that strength. Global semiconductor equipment sales are projected to reach about $125.5 billion in 2025, up 7.4% from the prior year, with process control and inspection tools among the key beneficiaries.[3] Within that context, KLA has highlighted that revenue from advanced packaging solutions alone surpassed $925 million in 2025, a 70% year-over-year increase that underscores how quickly this segment is scaling.[2]
Valuation and Street positioning
The stock’s powerful run has pushed valuation higher, but analysts remain divided on how much upside is left. Barclays, as cited by CNBC, pegs the consensus price target around $1,200 per share and carries a “Hold” rating on KLA, reflecting a view that much of the AI-driven optimism is already embedded in the price.[1] That stance captures a broader tension in the market between strong fundamentals and the risk that expectations have become stretched after a near-doubling of the stock this year.
According to historical data from TradeWave.ai, this powerful move is unfolding inside a long seasonal regime that has often been favorable for KLA in prior years. The next section looks at how that pattern has behaved over the past decade and what it suggests about typical upside and drawdown ranges.
Seasonal window
This seasonal window is currently underway, spanning 244 days, and has historically been a strong stretch for KLA Corporation. The stock enters this regime after a roughly 76% YTD gain in 2025, which means any additional seasonal tailwind is layering on top of an already extended move.[2][3] That combination of strong trend and supportive seasonality makes it important for investors to understand both the upside potential and the historical pattern of drawdowns inside this window.
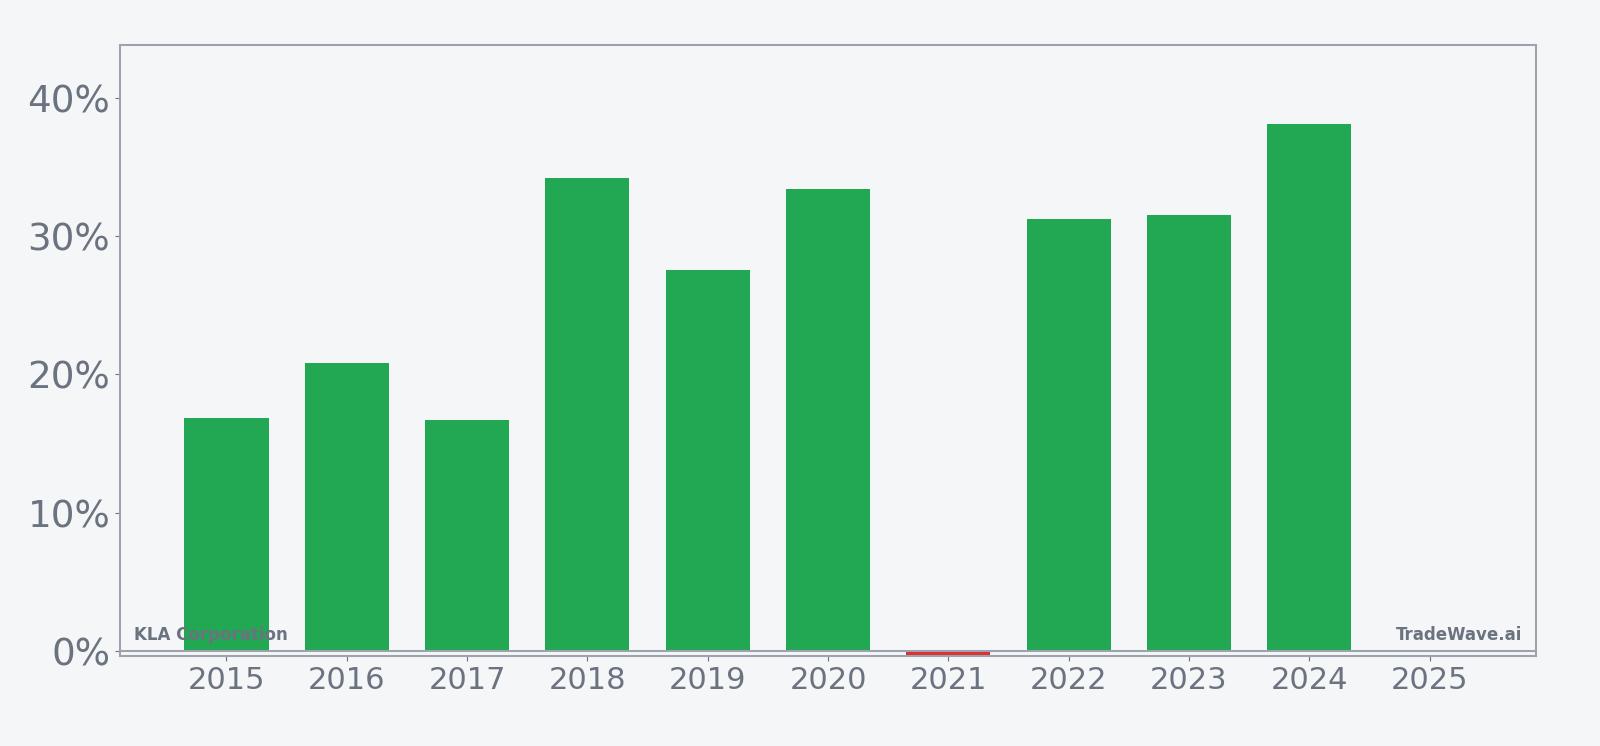
The trade direction for this pattern is explicitly long, and historically it has been favorable more often than not. Across the past 10 years, 9 seasons finished with positive net returns and only 1 ended lower, producing a 90% profitable rate for this window. Average gains in the winning years were 27.81%, while the average outcome across all years, including the lone loss, was still a robust 25%.
Individual years show how that plays out in practice. In 2024, for example, the window produced a net return of 38.11%, while 2023 delivered 31.5% and 2018 saw 34.19% as the stock trended higher from entry to exit. The one losing year in the sample, 2021, finished down just 0.35%, even though the stock experienced a much deeper intraperiod drawdown before recovering toward the end of the window.
Intraperiod swings have been meaningful. The maximum favorable move, or best point-to-peak gain, reached 67.55% in 2023 and exceeded 40% in several other years, highlighting how far the stock has sometimes run inside this regime before the window closed. On the downside, the maximum adverse move, or worst drawdown from entry, reached as much as 31.43% in 2019 and 28.78% in 2021, showing that even ultimately successful seasons have included sizable pullbacks along the way.
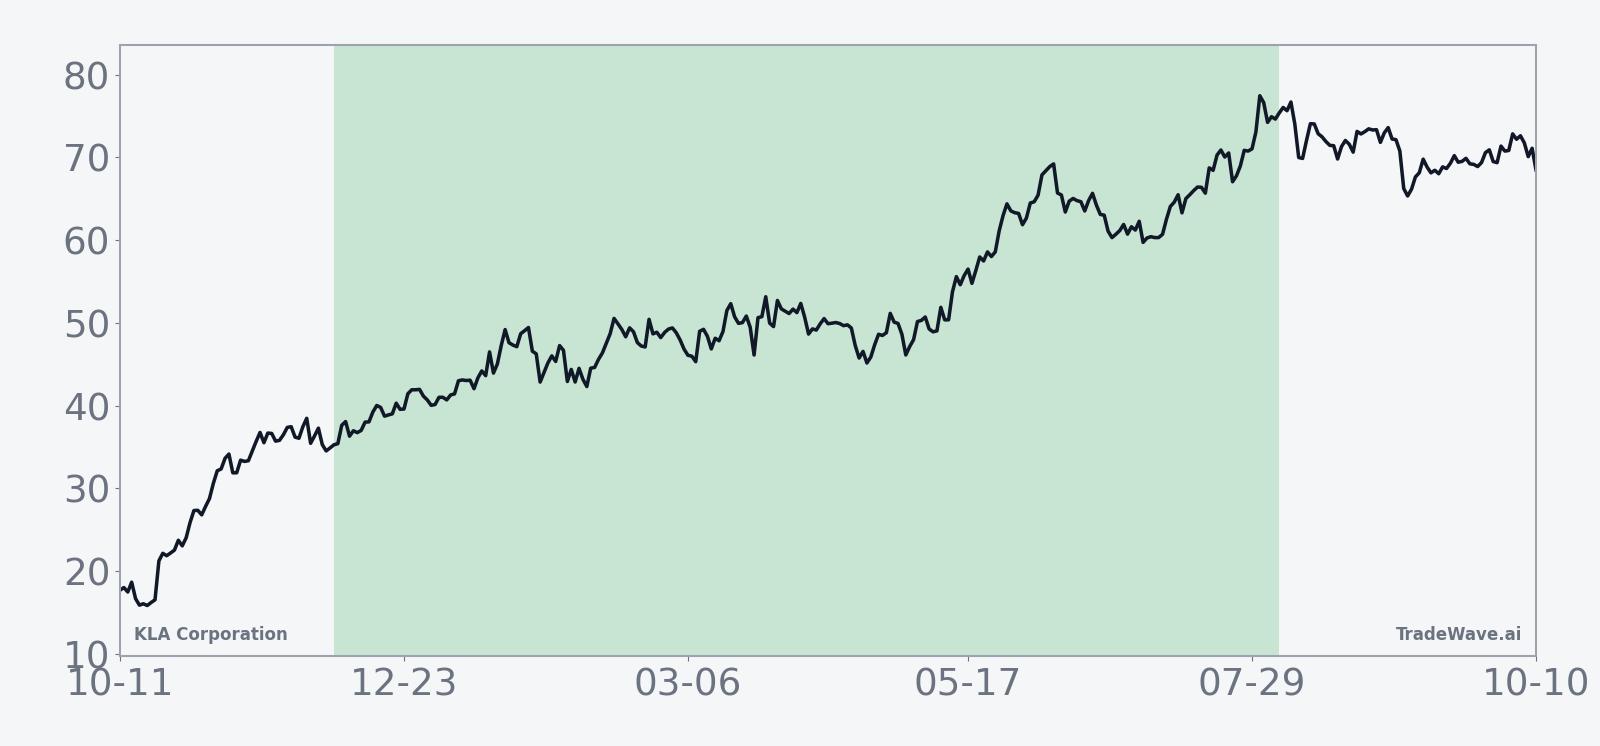
The 10-year average trend line suggests that returns tend to build relatively steadily through the middle of the window, with some choppiness early on and a tendency for gains to consolidate toward the later stages. That pattern is consistent with several years in which the stock experienced an early dip or sideways phase before stronger upside emerged as the window progressed.
Year-by-year bars that combine net results with peak gains and worst drawdowns help clarify how upside and downside have coexisted in this regime.
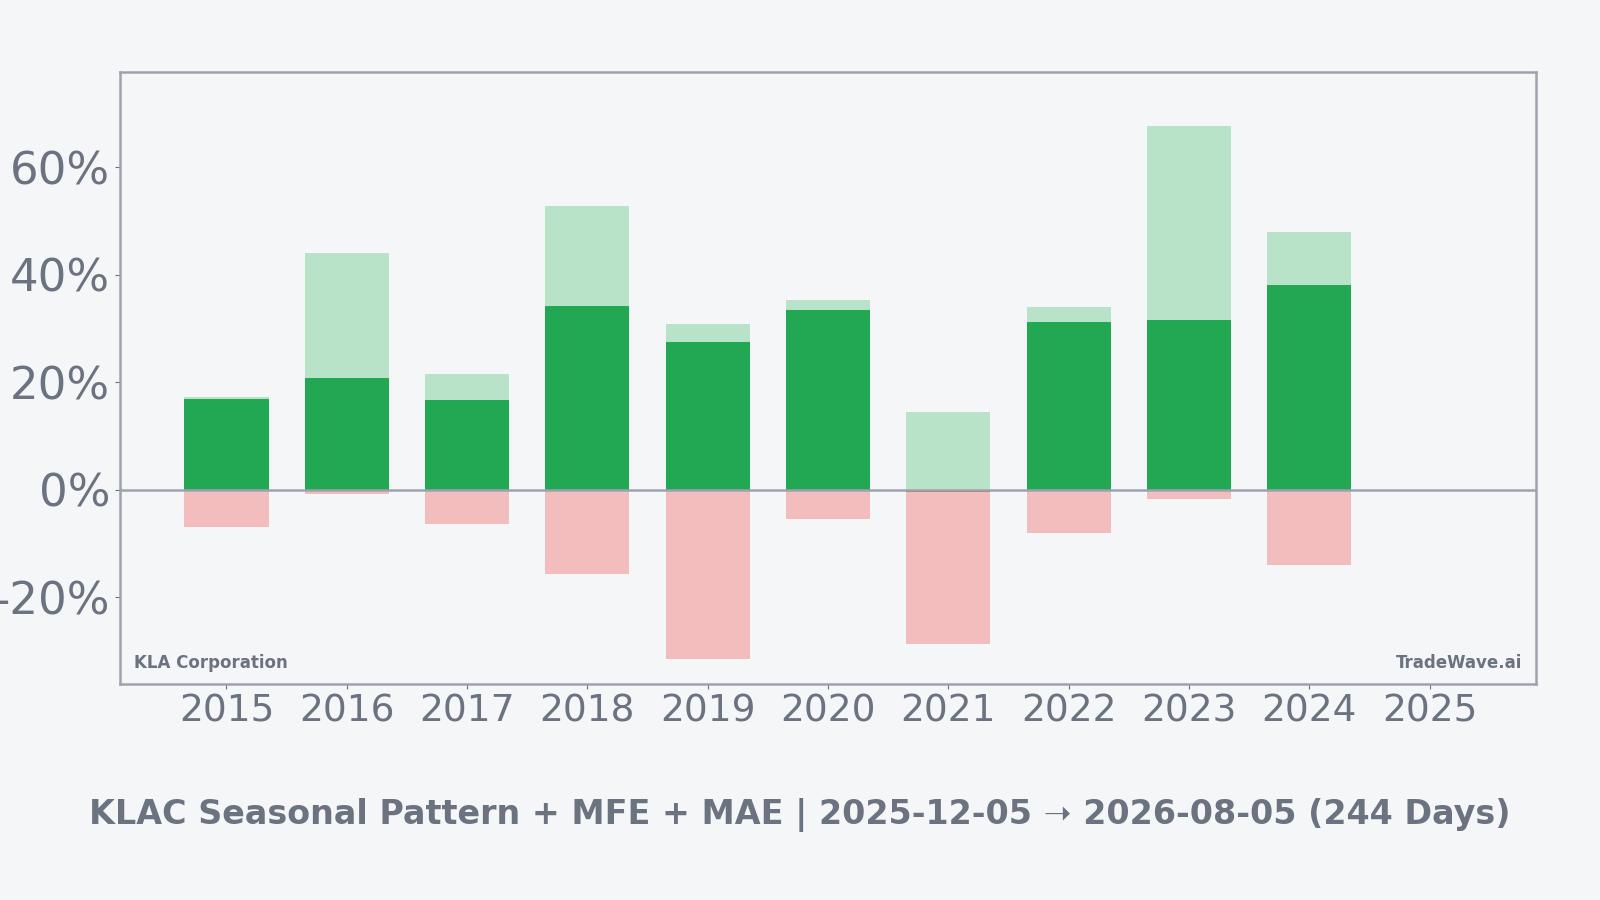
Those bars show that in most years the maximum favorable move has been substantially larger than the final net gain, while the maximum adverse move has often involved double-digit drawdowns even when the season finished higher. Taken together, the historical pattern defines the quantitative seasonal backdrop for the current period.
History does not guarantee future results; adverse excursions (MAE) can be large even in winning windows.
What to watch
For investors tracking KLA through this seasonal window, the first focal point is earnings. The next quarterly report will test whether the company can extend its recent streak of upside surprises and maintain optimistic guidance for Q2 fiscal 2026 and beyond, particularly around AI and advanced packaging demand.[2] Any sign of slowing orders or more cautious commentary from management would challenge the historically strong seasonal backdrop.
Sector conditions are the second key variable. The current upcycle in semiconductor equipment, with global sales projected to reach about $125.5 billion in 2025, has been a major tailwind for KLA.[3] Investors will be watching for updates on capex plans from major foundry and logic customers, as well as any shifts in AI and high-performance computing spending that could alter the trajectory of process control tool demand.
Valuation and Street sentiment form the third pillar. With the stock already up roughly 76% this year and consensus targets around $1,200 per share from Barclays via CNBC, further gains would likely require either stronger-than-expected earnings or a reassessment of how durable the AI-driven cycle will be.[1][2][3] How the stock trades around those catalysts, and whether pullbacks remain contained relative to the historical drawdown profile, will help indicate whether this season follows the pattern of prior strong years or looks more like the rare soft patch seen in 2021.
Finally, price behavior inside the window itself will be an important signal. Historically, KLA has often experienced meaningful corrections within this regime before resuming its advance, so traders will be watching whether any future dips stay within the typical adverse range or break below it. If the stock can absorb volatility around earnings and sector headlines while maintaining its broader uptrend, it would be consistent with the long-biased seasonal pattern that has dominated the past decade.
Sources
- CNBC, “A clear winner is emerging in the semiconductor equipment space, says Barclays,” Oct 20, 2025.
- Forbes, “What Is Happening With KLA Stock?”, Nov 11, 2025.
- Forbes, “What Is Happening With KLA Stock?”, Oct 27, 2025.
- Forbes, “What’s Happening With KLA Stock?”, Sep 11, 2025.
- TradeWave.ai, KLAC 244-day seasonal window statistics and charts, accessed Dec 5, 2025.
- TradeWave.ai, KLAC price chart, past 12 months, accessed Dec 5, 2025.
- TradeWave.ai, KLAC 10-year average seasonal trend chart, accessed Dec 5, 2025.
- TradeWave.ai, KLAC per-year net return bars for the seasonal window, accessed Dec 5, 2025.
- TradeWave.ai, KLAC net, MFE and MAE bars for the seasonal window, accessed Dec 5, 2025.
- TradeWave.ai, KLAC hero image and summary statistics, accessed Dec 5, 2025.