Union Pacific Corporation (UNP) trades inside a historically strong seasonal window
Union Pacific Corporation is entering a 73-day stretch that has often been favorable for its stock just as investors digest stronger profits and a potential mega-merger in a challenging freight rail backdrop.

Key takeaways
- The current seasonal window for Union Pacific Corporation begins Dec 5 and spans 73 trading days, with a long trade direction over the past decade.
- Historically, this stretch has been strong, with 90% of years profitable, including 9 winners and 1 loser across the 10-year sample.
- Average gains in winning years have been 6.16%, while the all-years average, including the lone losing year, is 5%.
- The TradeWave Ratio of 2.45 suggests price has typically traveled meaningfully in the long direction within the window, even when final returns varied.
- Maximum favorable and adverse excursions show that upside moves have often been sizable, but intraperiod drawdowns can also be sharp in some years.
- This seasonal backdrop arrives as Union Pacific posts higher profits and pursues an $85 billion Norfolk Southern merger that could reshape U.S. freight rail.
According to historical data from TradeWave.ai, this part of the calendar has shown a distinct pattern for Union Pacific’s stock in recent years. The following section looks at how that seasonal behavior lines up with today’s fundamentals and market narrative.
Seasonal window
This seasonal window is currently underway, spanning 73 days, and has historically been a strong stretch for Union Pacific Corporation. The stock closed today at $224.74, up 1.91% on the session, with investors lacking clear 52-week or year-to-date markers but watching the name closely as it trades near the upper end of its recent range.[2]
Across the last 10 years, this long-biased window has produced profitable outcomes in 9 of 10 instances, with an average gain of 6.16% in winning years and a 5% average when the lone losing year is included. The median profit of 5.67% and a Sharpe ratio of 1.05 point to a relatively consistent positive skew in end-of-window results, even as individual years have varied in strength.
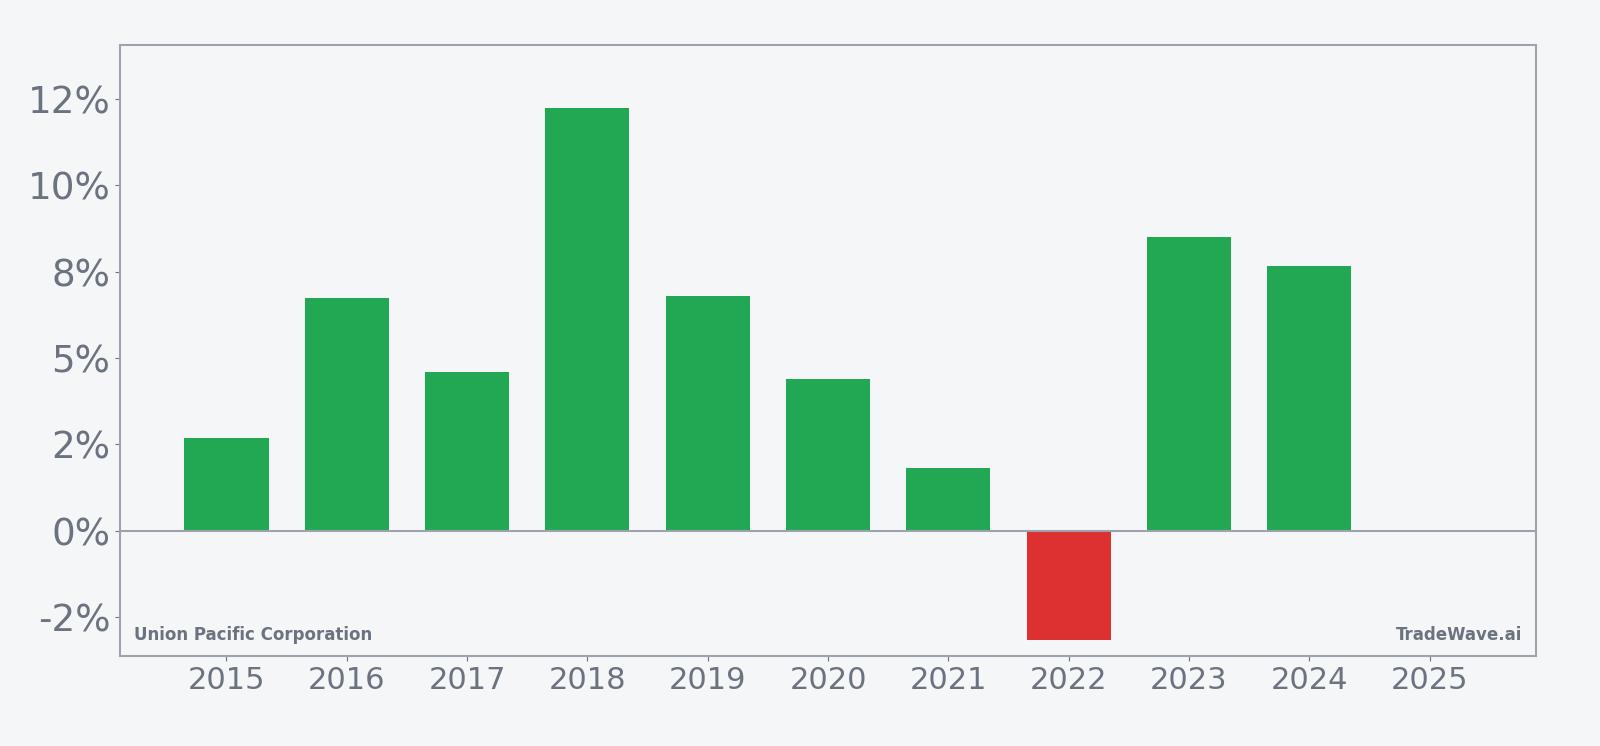
The per-year breakdown highlights both the upside potential and the occasional setback. The strongest year in the sample was 2018, when the stock gained 12.24% during the window, with a maximum favorable move of 12.97% from the entry level before giving back a small portion into the close. The weakest outcome was 2022, which delivered a net loss of 3.17% despite a maximum favorable move of 5.05%, underscoring that even in a generally supportive seasonal phase, reversals can occur late in the window.
Intraperiod swings have been meaningful. In 2015, for example, the stock finished the window up 2.69% but experienced a maximum adverse move of 13.24% from the entry price at one point, illustrating how drawdowns can be much larger than the final net gain. By contrast, years like 2019 and 2023 saw relatively modest downside, with maximum adverse moves of just 0.21% and 0.59% respectively, while still delivering net gains of 6.81% and 8.52%.
The TradeWave Ratio of 2.45 suggests that, on average, price has tended to travel a fair distance in the long direction within this window, independent of where it ultimately closes. That aligns with the maximum favorable excursions, which have often reached the high single digits or low double digits, indicating that rallies during this period can be sizable when they develop.
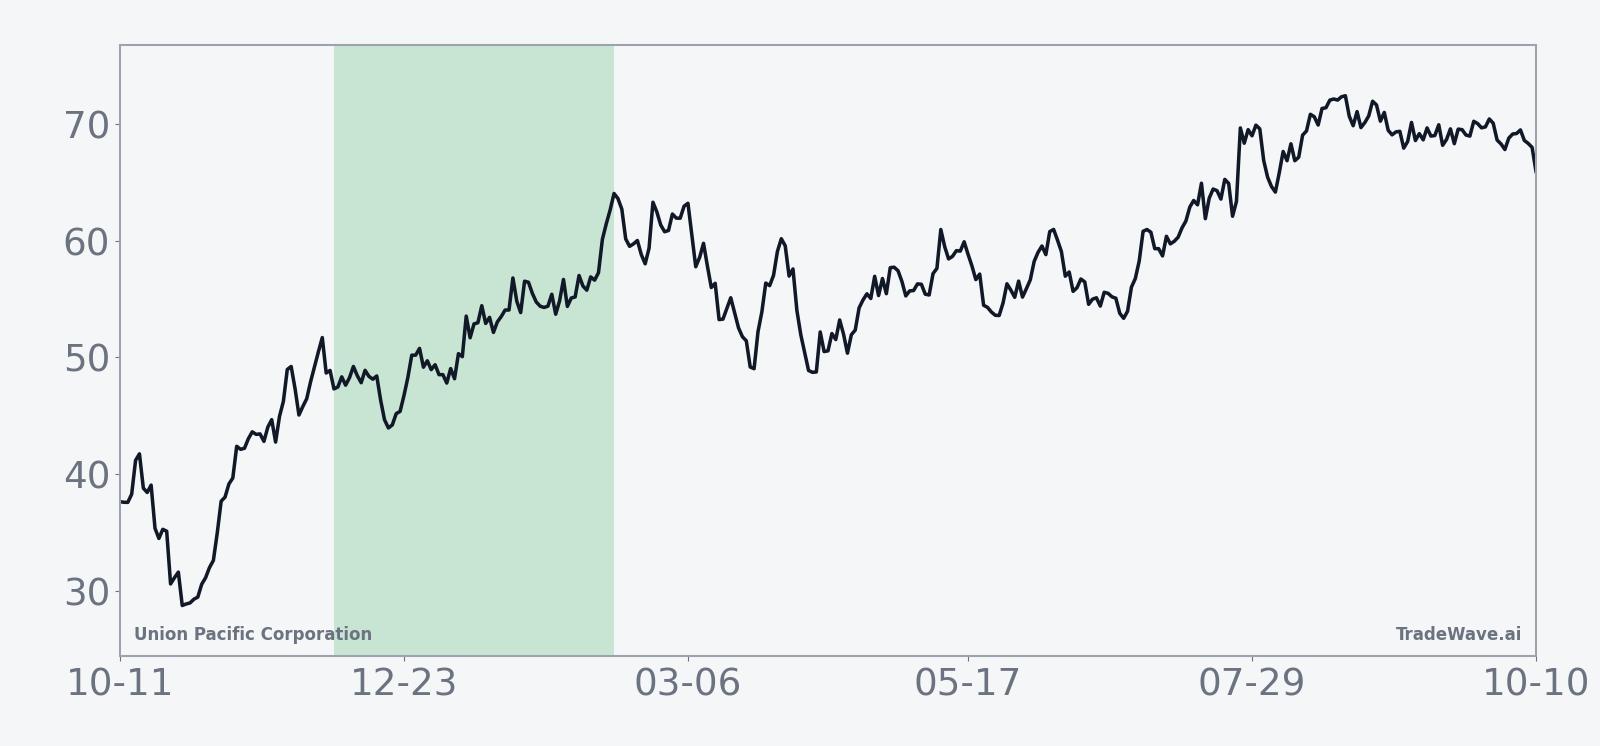
The 10-year average seasonal trend chart shows a generally upward-sloping profile, with gains tending to build gradually rather than in a single burst. In many years, the pattern has featured a constructive first half of the window, a mid-period consolidation, and then additional strength into the later stages, although the exact timing of peaks and pullbacks has varied.
A combined view of yearly net returns and intraperiod swings helps frame both upside potential and typical drawdown risk.
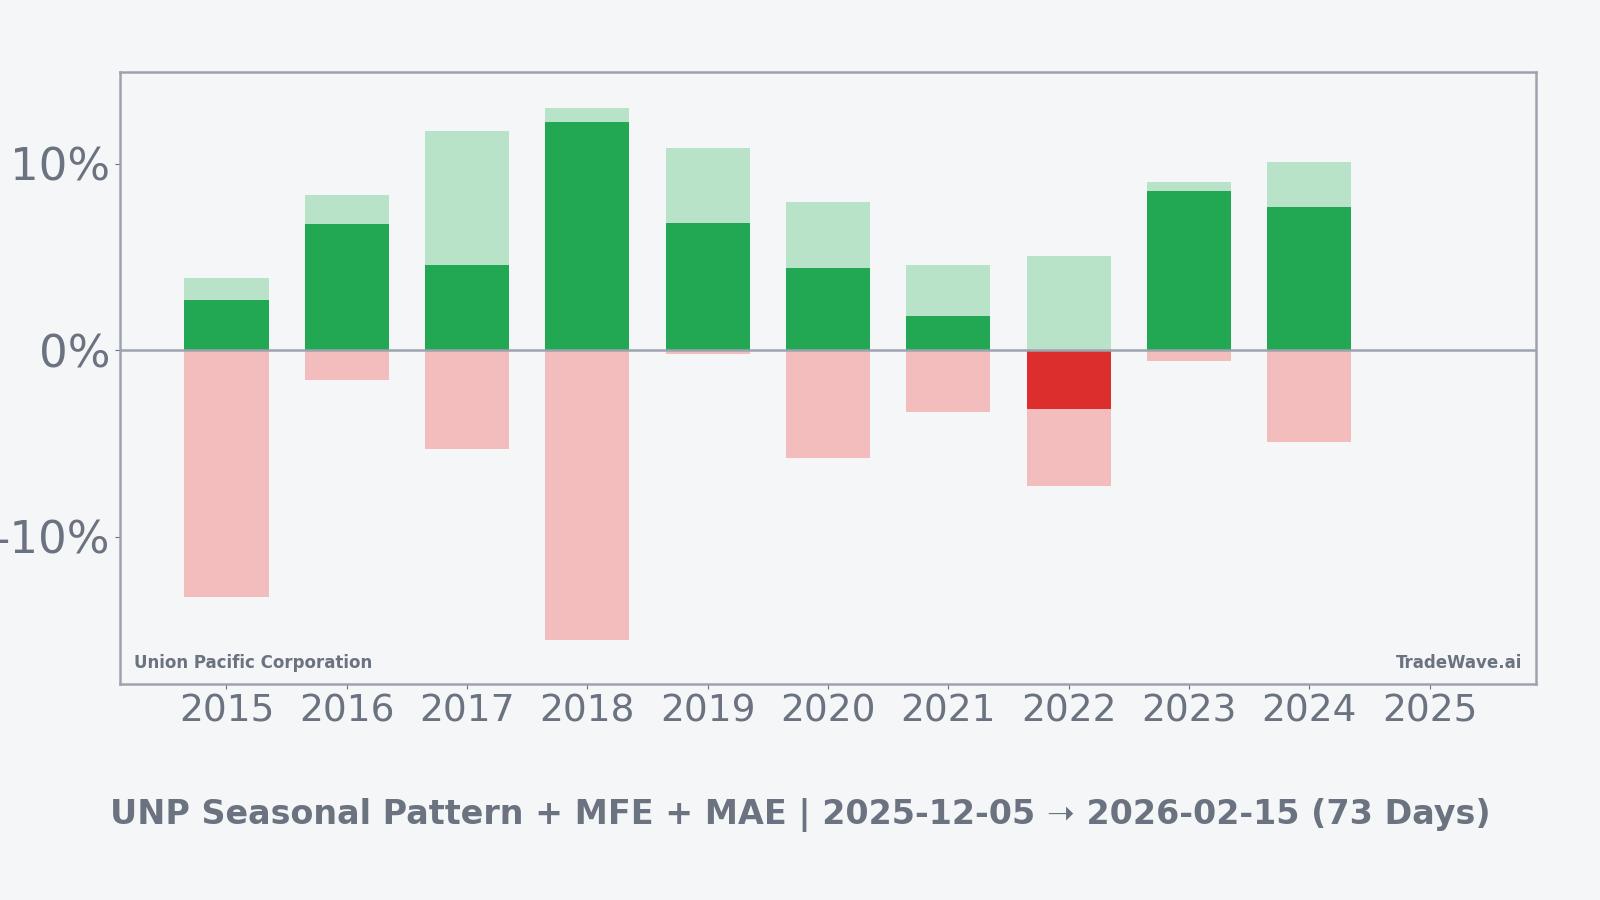
The stacked net, maximum favorable, and maximum adverse excursion bars show that in most years the stock has enjoyed solid upside runs within the window, but that adverse moves have occasionally been deep, particularly in 2015 and 2018. In other years, such as 2019, 2020, 2021, 2023, and 2024, downside excursions were more contained while upside remained in the mid- to high-single-digit range, suggesting a more favorable balance between opportunity and risk in those instances. Taken together, the historical pattern defines the quantitative seasonal backdrop for the current period.
History does not guarantee future results; adverse excursions (MAE) can be large even in winning windows.
Price and near-term drivers
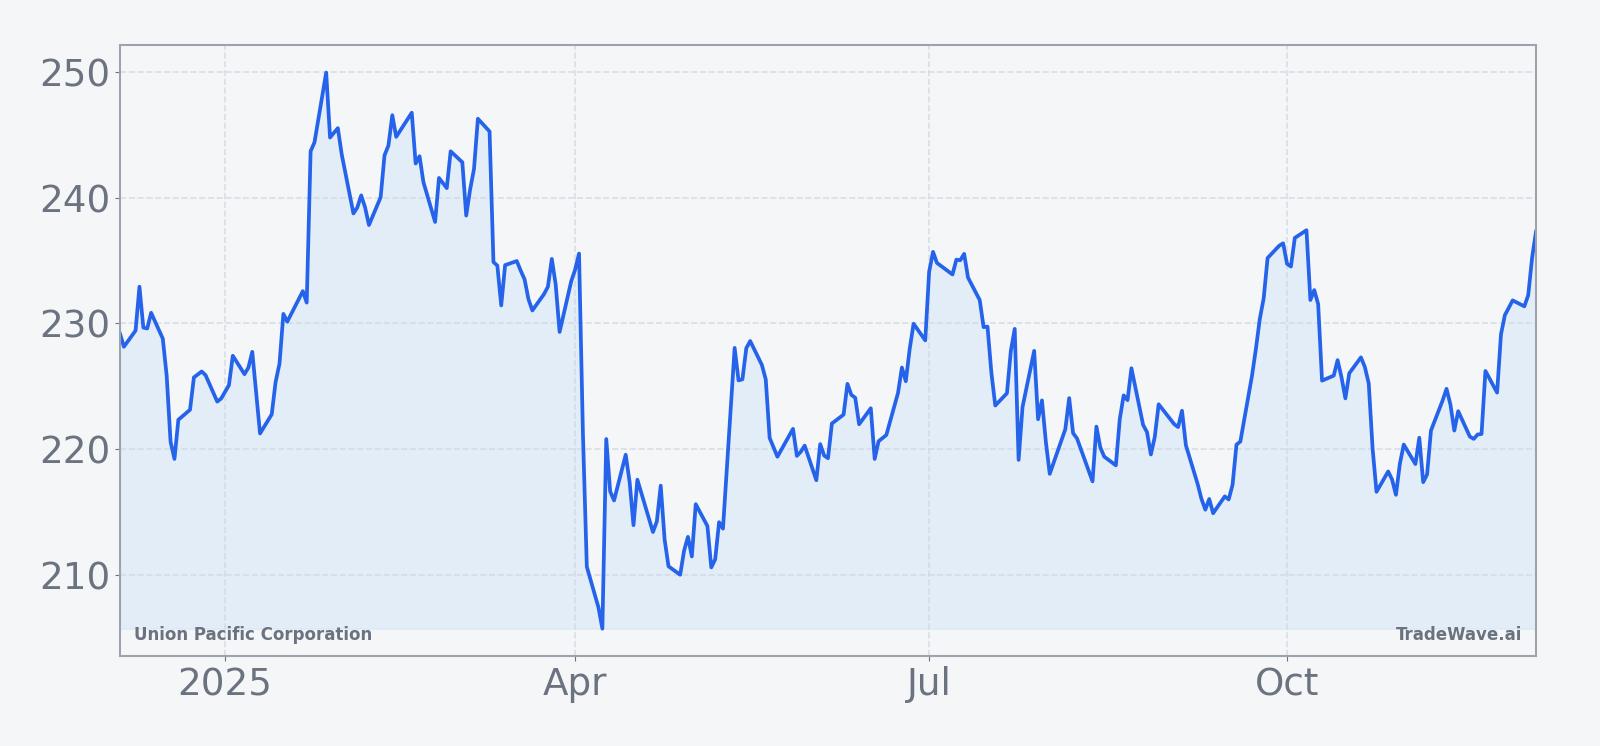
Union Pacific shares finished Friday at $224.74, rising 1.91% as traders continued to weigh the company’s earnings momentum and the potential impact of a transformational rail merger in a still-choppy freight environment.[2][4] The stock’s recent climb has come without clear public markers for its 52-week high or low, but the latest move keeps it trading near the upper band of its 12-month range as investors reassess the risk-reward profile heading into year-end.
The chart below situates the latest move in its recent multi-month context.
The fundamental backdrop has been supportive. In its most recent quarter, reported on Oct 23, Union Pacific delivered a 7% increase in profit, earning $1.79 billion, or $3.01 per share, up from $1.67 billion, or $2.75 per share, a year earlier.[2] Adjusted earnings per share were $3.08 after excluding $41 million in merger-related costs, topping Wall Street expectations of $2.97 per share and underscoring management’s ability to grow earnings despite cost pressures and operational challenges.[2][3]
At the same time, the company is at the center of a proposed $85 billion acquisition of Norfolk Southern that would create a transcontinental freight rail giant, subject to approval by the U.S. Surface Transportation Board and other regulators.[1][4][5] Reports over the summer indicated that Union Pacific and Norfolk Southern were in advanced talks, with multiple outlets describing the deal as a potential reshaping of the U.S. rail landscape and noting that an agreement could come together relatively quickly if regulatory hurdles can be addressed.[1][4][5][6][9][12]
The merger narrative is unfolding against a mixed industry backdrop. North American freight railroads are contending with volatile volumes, higher labor and fuel costs, and pressure from shippers over service reliability, all of which could influence how regulators view further consolidation.[4][7] For Union Pacific, the combination of stronger earnings, a large pending transaction, and a historically supportive seasonal window creates a complex setup in which both company-specific and macro rail dynamics may shape how the stock trades in the weeks ahead.
What to watch
For investors tracking this 73-day seasonal window, the first focal point will be whether Union Pacific can maintain its recent upward bias without experiencing the kind of deep intraperiod drawdowns seen in some past years. Historically, the pattern has favored gradual gains with occasional sharp setbacks, so how the stock behaves on pullbacks could signal whether this year is tracking closer to the stronger or weaker historical outcomes.
Fundamentally, any new developments around the proposed Norfolk Southern acquisition will be critical, including regulatory feedback from the Surface Transportation Board and any updates on deal structure or timing.[1][4][5][6][9][12] Investors will also be watching for signs of how freight volumes, labor negotiations, and fuel costs evolve across the broader rail sector, since shifts in those variables can quickly alter sentiment toward the group.[4][7]
On the earnings front, while the company has not provided detailed forward guidance in the latest reports, the market will be sensitive to any commentary about demand trends, pricing power, and merger-related synergies or costs in upcoming management appearances or filings.[2][3] A continuation of the recent profit growth, particularly if accompanied by stable or improving service metrics, would be more consistent with the positive seasonal tendency, whereas signs of margin pressure or operational setbacks could make the window more volatile.
Technically, traders may focus on how Union Pacific trades around recent highs and any emerging support zones that develop during pullbacks. A pattern of buying on dips with contained adverse moves would align with the more favorable historical years in this window, while a break of key support accompanied by larger-than-usual downside excursions would echo the outlier years where the seasonal tailwind did not translate into gains. Taken together, the interaction between merger headlines, rail-industry fundamentals, and price behavior inside this window will determine how closely 2025 tracks the historical seasonal script.
Sources
- [1] Seeking Alpha, “Union Pacific, Norfolk Southern said to be nearing a cash and stock merger deal” (Jul 26, 2025)
- [2] AP News, “Union Pacific reports 7% higher profits as its CEO makes the case for Norfolk Southern merger” (Oct 23, 2025)
- [3] Yahoo Finance, “Union Pacific reports 7% higher profits as its CEO makes the case for Norfolk Southern merger” (Oct 23, 2025)
- [4] Reuters, “Union Pacific in mega US railroad merger talks with rival Norfolk” (Jul 24, 2025)
- [5] Reuters, “Union Pacific to reshape US freight rail with $85 billion deal for Norfolk” (Jul 29, 2025)
- [6] Reuters, “Union Pacific could reach agreement to acquire Norfolk Southern early next week, Bloomberg News reports” (Jul 26, 2025)
- [7] Reuters Breakingviews, “Railway mega-deal would require heavy engineering” (Jul 18, 2025)
- [8] Reuters, “Union Pacific nearing agreement to buy Norfolk Southern, Bloomberg reports” (Jul 26, 2025)
- [9] Reuters, “Union Pacific exploring deal to buy Norfolk Southern, WSJ reports” (Jul 17, 2025)
- [10] TradeWave.ai, Union Pacific seasonal pattern window starting Dec 5, 2025 (accessed Dec 5, 2025)