Dow Jones Utility (DJU) trades inside a historically strong seasonal window
Dow Jones Utility is moving through a historically supportive late-December stretch as investors balance defensive utilities exposure against broader equity gains into year-end.

Key takeaways
- Dow Jones Utility is in a 7-day late-December window that has historically been constructive for the index, with a long trade direction bias.
- Across the past 10 years, this pattern has been profitable in 90% of cases, with 9 winners and 1 loser.
- Average gains in winning years have been 1.01%, while the all-years average that includes the lone loss is 1%.
- The historical profile shows modest but consistent upside, with a cumulative 8% gain over the sample and a Sharpe ratio of 0.8.
- Intraperiod swings have featured both favorable and adverse moves, underscoring that utilities can still be volatile even in a seasonally supportive window.
- This backdrop arrives as investors reassess defensive sectors like utilities against broader equity benchmarks into the final trading days of the year.[2]
According to historical data from TradeWave.ai, this late-December stretch for Dow Jones Utility has shown a distinct and repeatable seasonal tendency over the past decade. The following section unpacks how that pattern has behaved and what it may signal for the current period.
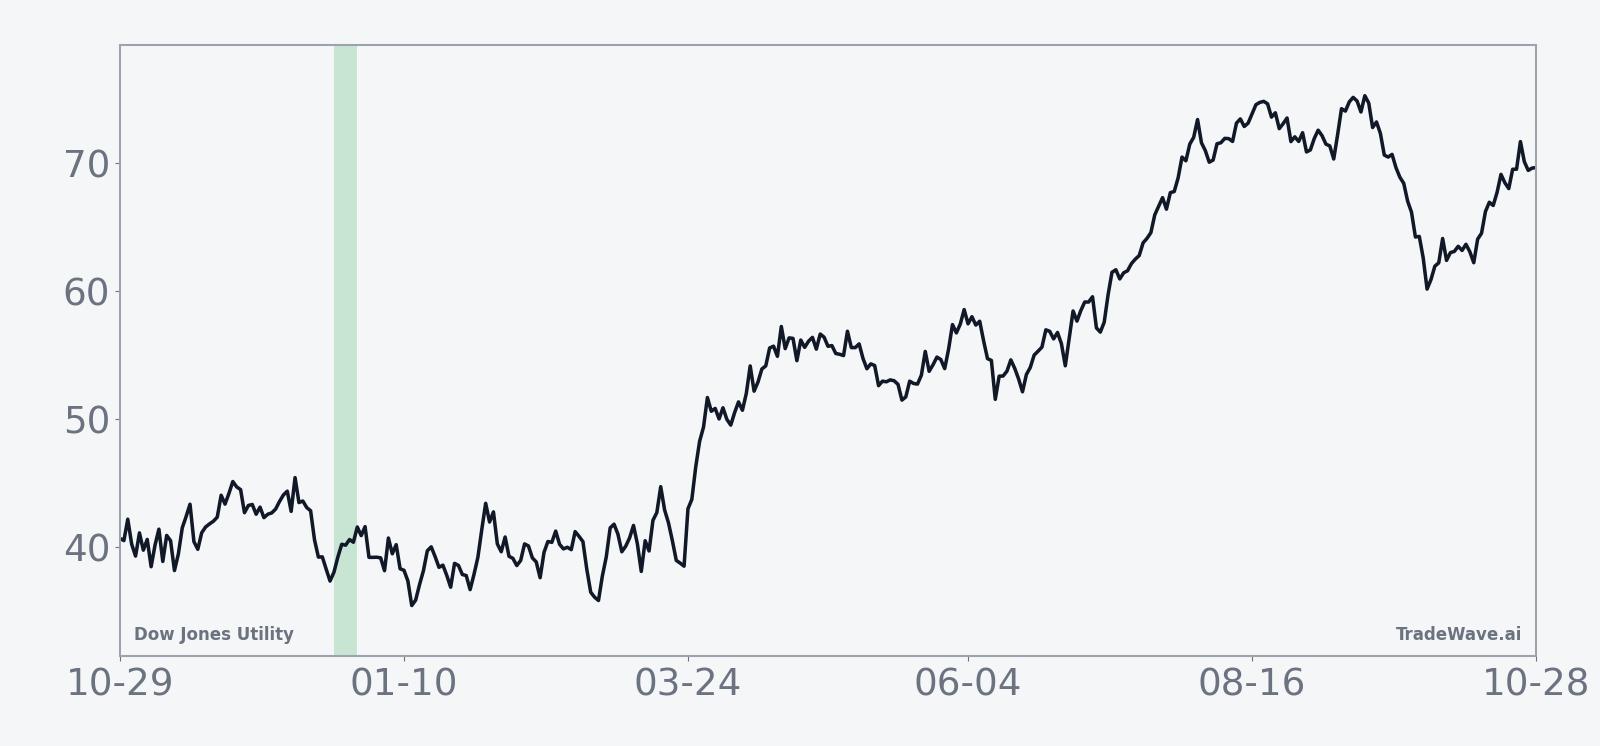
Seasonal window
This seasonal window is currently underway, spanning 7 days from Dec 23 and has historically been a constructive stretch for Dow Jones Utility. With the index trading near the end of a strong year for broader U.S. equities, utilities are again being evaluated as a stabilizing counterweight in multi-asset portfolios as the calendar turns.[2]

Across the last 10 years, this 7-day pattern has favored the long side, with 9 winning years and just 1 losing outcome. Percent Profitable stands at 90%, meaning that in most years the index finished the window higher than it began. Average profit in the winning years has been 1.01%, while the average across all years, including the single loss, is 1%, pointing to relatively contained downside in the weaker instances.
The per-year breakdown shows that the strongest gain in the sample came in 2018, when Dow Jones Utility advanced 3.02% over the window, supported by a maximum favorable move of 3.92% from the entry level. At the other end of the spectrum, 2024 was the lone losing year, with a net decline of 0.5% and a worst intraperiod drawdown of 1.47% from the starting point. That mix of outcomes illustrates that while the pattern has leaned positive, utilities have still experienced meaningful short-term swings inside the window.
Looking at intraperiod behavior, the historical maximum favorable excursions have often exceeded the final net gains, suggesting that rallies within the window can be front-loaded or partially retraced before the period ends. Maximum adverse excursions, by contrast, have tended to be smaller in magnitude than the best upside moves in most years, but the 2018 and 2024 episodes highlight that short, sharp drawdowns are still part of the profile. For traders and risk managers, this combination points to a window where upside has historically dominated, yet where position sizing still matters because of occasional deeper dips.
The 10-year average trend line for this window shows a generally upward-sloping profile, with gains tending to build steadily rather than arriving in a single spike. In several years, the index has seen early-session softness followed by a grind higher into the final days of the period, which fits the idea of utilities benefiting from late-year portfolio rebalancing and defensive positioning.
Year-by-year net returns and intraperiod swings help clarify how consistently this pattern has played out.
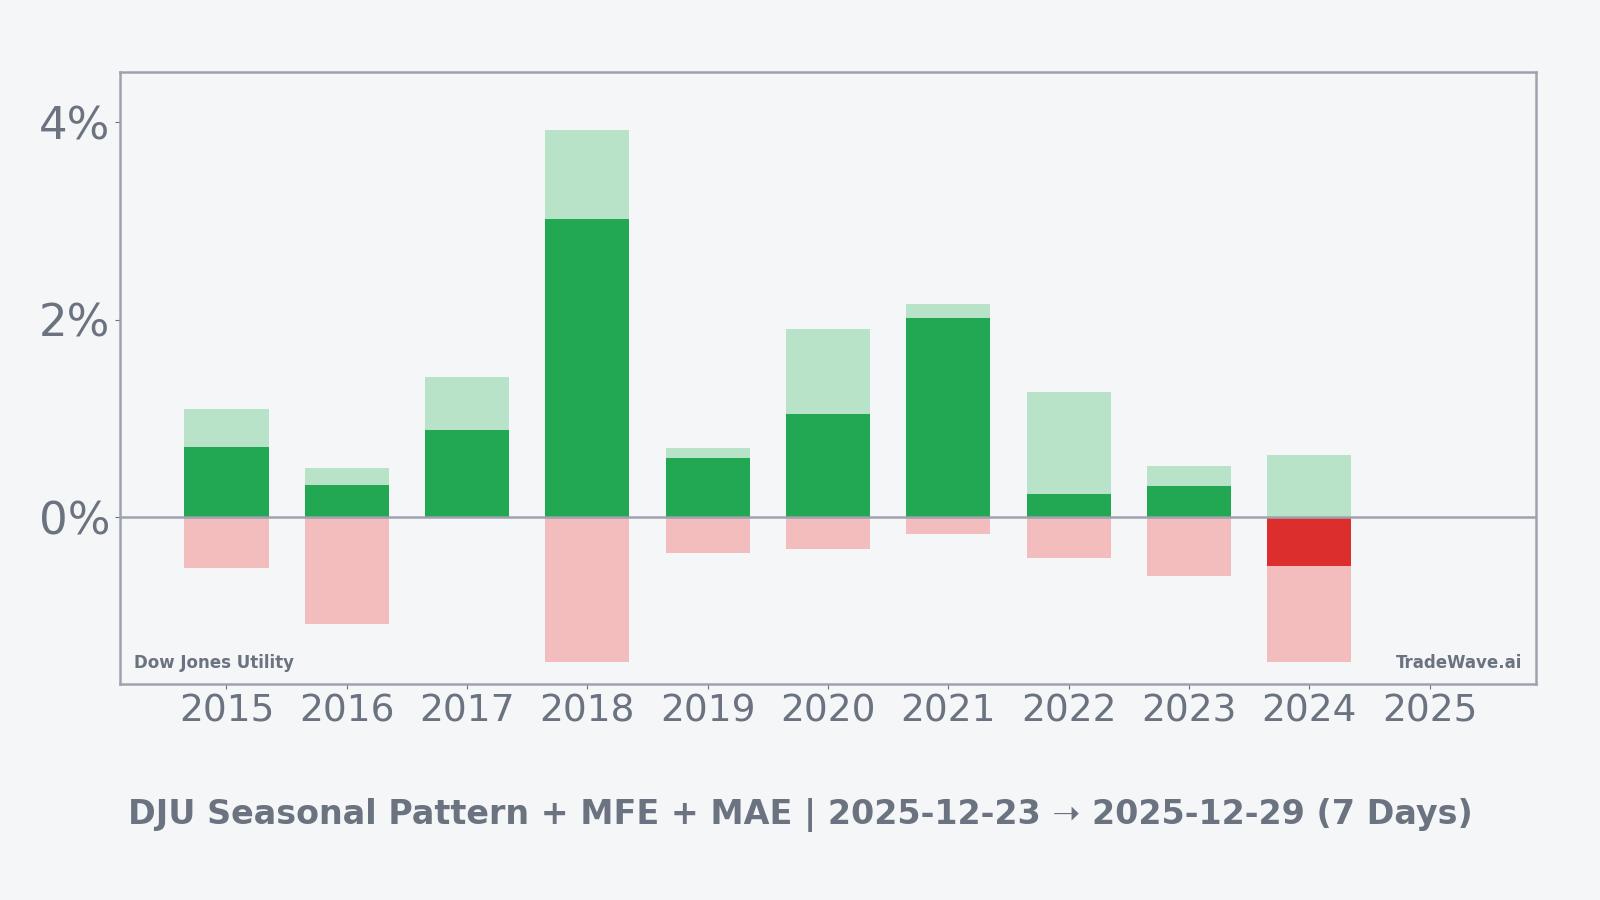
The combined net, maximum favorable, and maximum adverse excursion bars show that in most years the best intraperiod rally has comfortably outpaced the worst drawdown, consistent with the long bias of the pattern. Even so, the presence of years where the adverse move approaches or exceeds 1% underlines that utilities can still experience notable volatility over just a few sessions, particularly when macro or rate headlines intersect with this seasonal phase.
History does not guarantee future results; adverse excursions (MAE) can be large even in winning windows.
Taken together, the historical pattern defines the quantitative seasonal backdrop for the current period.
Price and near-term drivers
With detailed real-time pricing for Dow Jones Utility less visible than for headline equity benchmarks, investors are focusing more on the index’s role as a defensive counterweight while the S&P 500 and other major gauges trade near recent highs into the holiday-shortened week.[2] Utilities have featured regularly in recent energy and power-sector commentary, where analysts have highlighted how regulated returns and dividend profiles can appeal when growth sectors have already logged strong gains for the year.[3]
Broader market tone has been constructive into the final stretch of December, with Wall Street indices finishing higher to start the week as investors balanced easing inflation pressures against the prospect of slower growth in 2026.[2] In that environment, utilities sit at the intersection of rate expectations and equity risk appetite: lower yields can support the sector’s income appeal, while any renewed volatility in cyclicals can send investors back toward more stable cash-flow profiles.[4]
Recent energy and utilities roundups have also emphasized the sector’s sensitivity to policy and regulatory developments, from grid investment to decarbonization mandates, which can influence capital spending plans and allowed returns.[5] For index-level investors, those dynamics matter less at the single-company level and more in terms of how the group behaves relative to other defensives such as consumer staples and health care, particularly when macro headlines are thin and flows are driven by asset-allocation decisions rather than stock-specific news.[6]
Against that backdrop, the current seasonal window for Dow Jones Utility effectively overlays a historically supportive pattern on top of a market that is already leaning toward risk assets, creating a nuanced setup for the final trading days of the year. If utilities continue to hold firm or grind higher while growth sectors consolidate, it would fit the historical tendency for this window to deliver modest positive returns, while a sharp break lower would stand out as a departure from the past decade’s behavior.
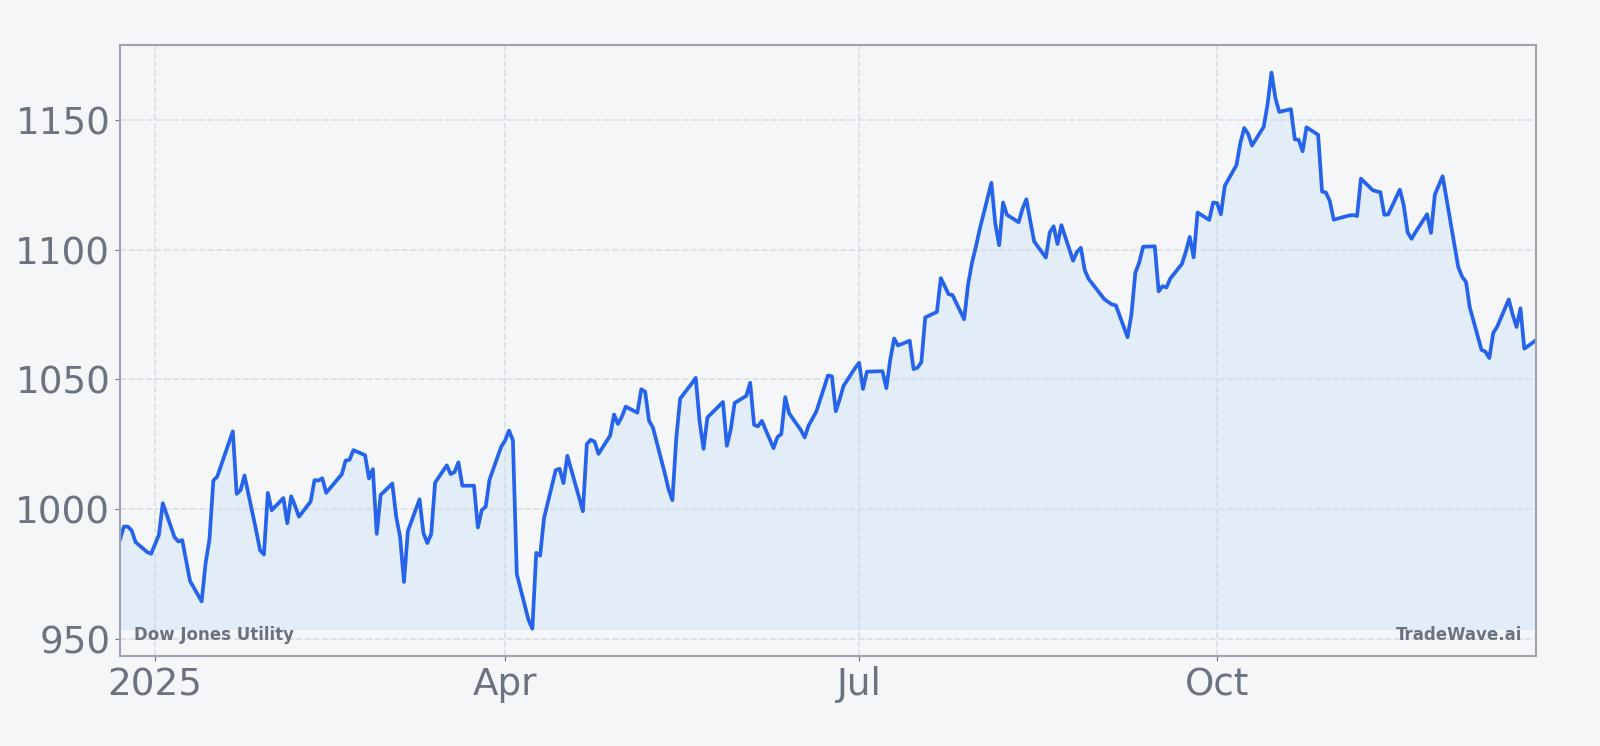
The chart below situates the latest move in its recent multi-month context.
What to watch
For the remainder of this 7-day window, traders and portfolio managers will be watching how Dow Jones Utility behaves relative to its recent range and to broader equity benchmarks. A continuation of the pattern’s historical tendency, with modest gains and limited drawdowns, would reinforce the idea that late December remains a supportive period for utilities. By contrast, a decisive break lower or unusually large intraperiod volatility would signal that macro or policy forces are overwhelming the typical seasonal backdrop.
Key items to monitor include the relative performance of utilities versus the S&P 500 and other major indices, particularly on days when macro news is light and flows are driven more by rebalancing than by headlines.[2] Any shift in rate expectations, whether through economic data or central-bank commentary, could also influence the sector’s appeal as an income proxy, with knock-on effects for the Dow Jones Utility index.[11]
Investors will also be watching breadth within the utilities space, including how regulated power names, pipelines, and diversified energy infrastructure stocks trade relative to one another, as that internal leadership can hint at how the index might behave once the seasonal window closes.[3] Finally, behavior in the first few sessions of January will be important: if utilities give back late-December gains quickly, it would suggest that the seasonal pattern remains largely confined to this short window, whereas sustained strength could indicate that defensive positioning is building more broadly into the new year.
Sources
- [1] Barchart.com, “3 High-Growth Dividend Kings For Generations of Income,” Nov 15, 2025.
- [2] Seeking Alpha, “Wall Street finished higher to kick off the holiday shortened trading week,” Dec 22, 2025.
- [3] The Wall Street Journal, “Energy & Utilities Roundup: Market Talk,” Mar 5, 2025.
- [4] The Wall Street Journal, “Energy & Utilities Roundup: Market Talk,” Aug 26, 2025.
- [5] The Wall Street Journal, “Energy & Utilities Roundup: Market Talk,” Aug 21, 2025.
- [6] The Wall Street Journal, “Energy & Utilities Roundup: Market Talk,” Dec 9, 2025.
- [7] MarketBeat, “HudBay Minerals Inc Stock Holdings Raised by Franklin Resources Inc.,” Dec 1, 2025.
- [8] MarketBeat, “Andrada Mining (LON:ATM) Trading Down 2.8% - What's Next?,” Dec 19, 2025.
- [9] MarketBeat, “Eurasia Mining (LON:EUA) Shares Up 6.1% - Time to Buy?,” Dec 17, 2025.
- [10] MarketBeat, “Jaguar Mining (OTCMKTS:JAGGF) Shares Up 4.5% - What's Next?,” Dec 23, 2025.
- [11] Seeking Alpha, “S&P 500: This Is Unusual, Week Starting 7th July (Technical Analysis),” Jul 6, 2025.
- [12] Barchart.com, “Rosen Law Firm Encourages Soleno Therapeutics Investors to Inquire About Investigation,” Oct 5, 2025.
- [13] Barchart.com, “As SoundHound Announces New Apivia Deal, Should You Buy, Sell, Or Hold SOUN Stock?,” Oct 8, 2025.