Microsoft (MSFT) trades inside a historically strong seasonal window
Microsoft shares are up solidly in 2025 as the stock moves through a historically strong multi-quarter seasonal stretch, with AI-driven growth and recent earnings beats shaping expectations for the months ahead.

Key takeaways
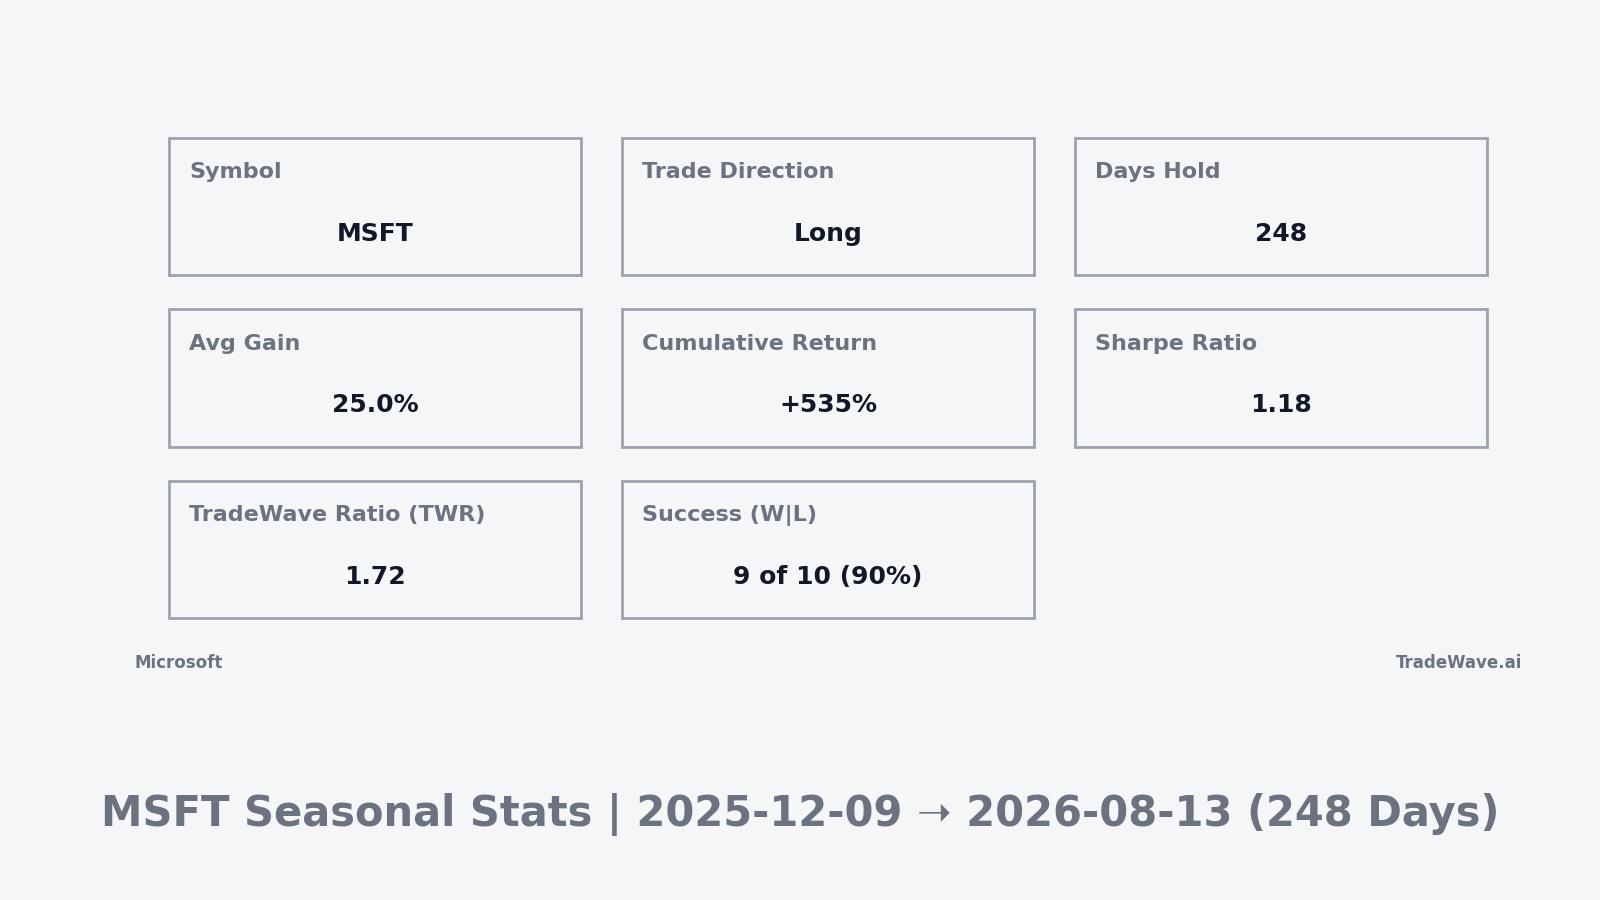
- Microsoft is currently in a 248-day seasonal window that has historically been strong for long positions, with a clear upside bias across the past decade.
- Across 10 years of data, the pattern has been profitable in 90% of cases, with 9 winning years and 1 losing year for this window.
- Average gains in winning years have been 24.97%, while the all-years average that includes the lone losing year is still a robust 21%.
- Historical maximum favorable moves inside the window have often exceeded 30%, but adverse excursions have at times reached more than 20% on the downside, underscoring meaningful volatility risk.
- The current window began on Dec 9, 2025 and typically spans much of the following year, overlapping key earnings reports and AI-related catalysts for the company.
- With Microsoft up about 19% year to date and analysts maintaining a Buy stance with a $600 consensus target, the seasonal backdrop adds another supportive factor to an already constructive fundamental story.[1][2][3][4][5]
Seasonal window
This seasonal window is currently underway, spanning 248 days, and has historically been a strong stretch for Microsoft. The stock last traded around $534.05 on Dec 10, up about 4.05% on the day and roughly 19% so far in 2025, leaving it near record territory without a clearly defined 52-week band in the latest data.[3][5]
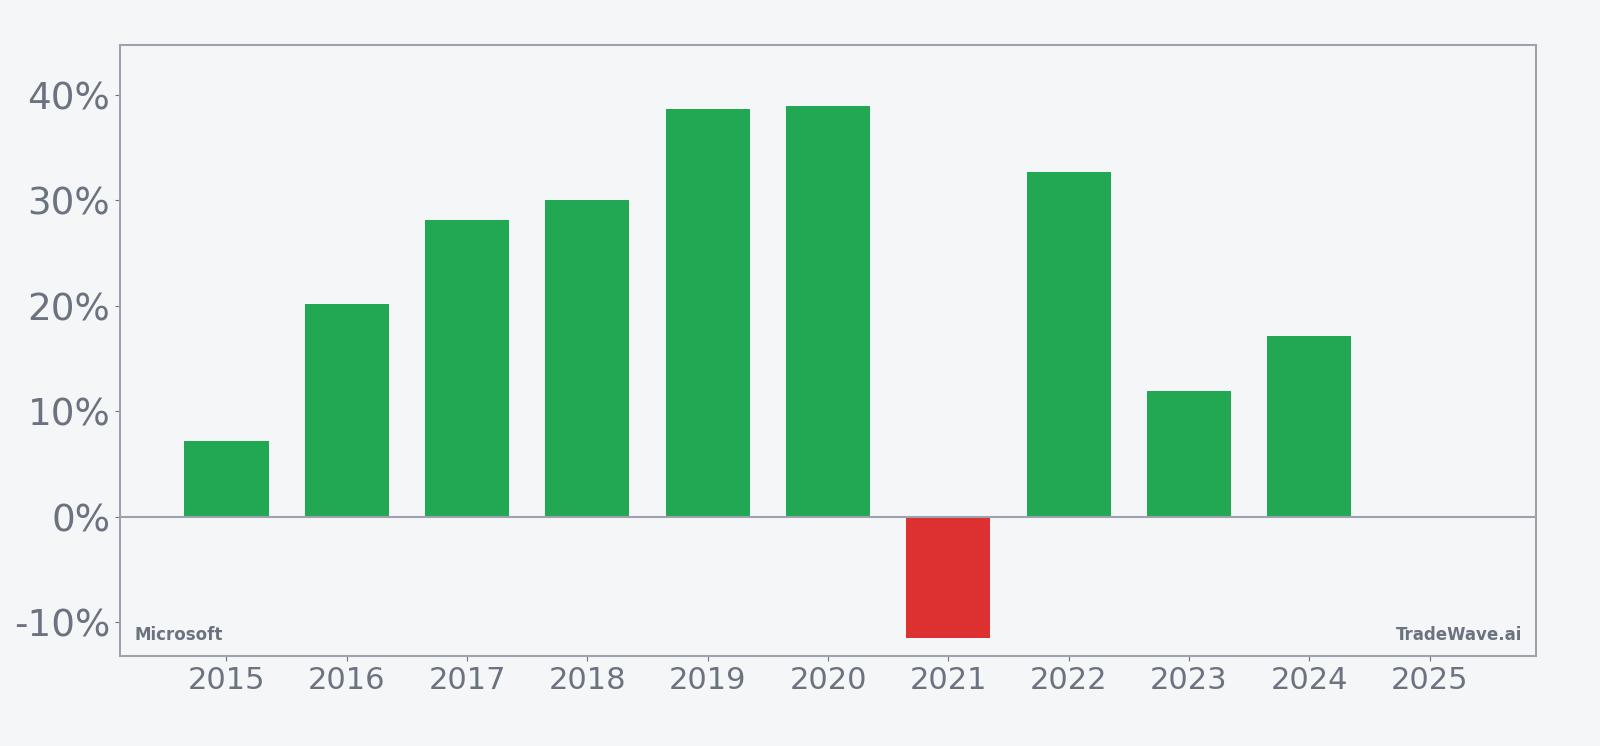
Based on this long trade direction, positive years are those in which Microsoft rallied over the full 248-day span, while the single losing year reflects a period when the stock finished lower despite the broader pattern. The 90% Percent Profitable rate, with 9 winners and 1 loser, points to a historically consistent upside tendency, although the 21% Avg Profit - All shows that the lone down year meaningfully pulled back the otherwise higher 24.97% average gain in winning years.
Looking at individual years, 2019 stands out as one of the strongest examples, with a net return of 38.64% and a maximum favorable move of 44.58% from the entry price, while 2021 marks the weakest outcome with an 11.51% loss and a worst intraperiod drawdown of 27.18% from entry. These bookends illustrate how the same window can deliver both powerful rallies and deep setbacks depending on the broader market and company-specific backdrop.
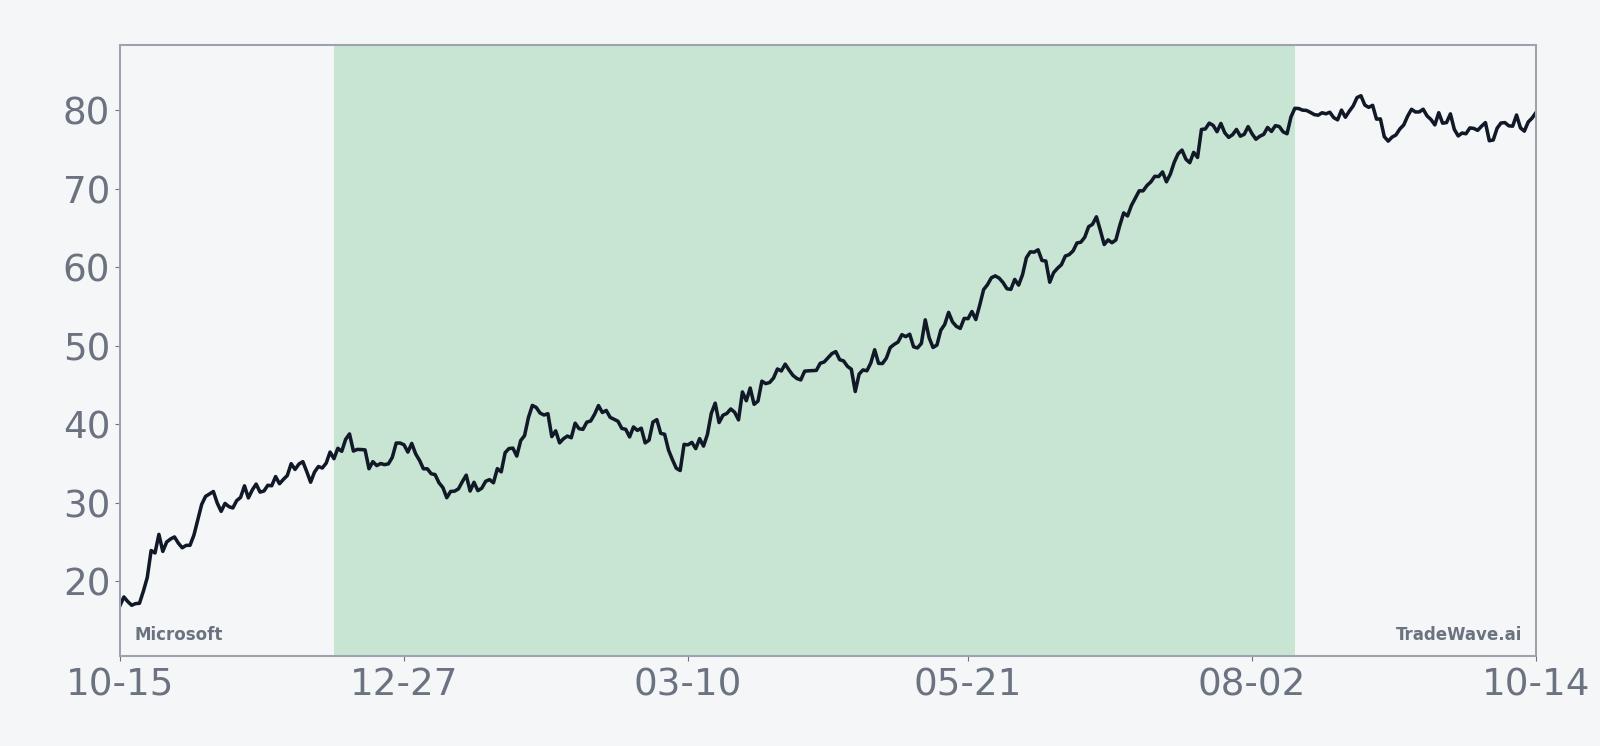
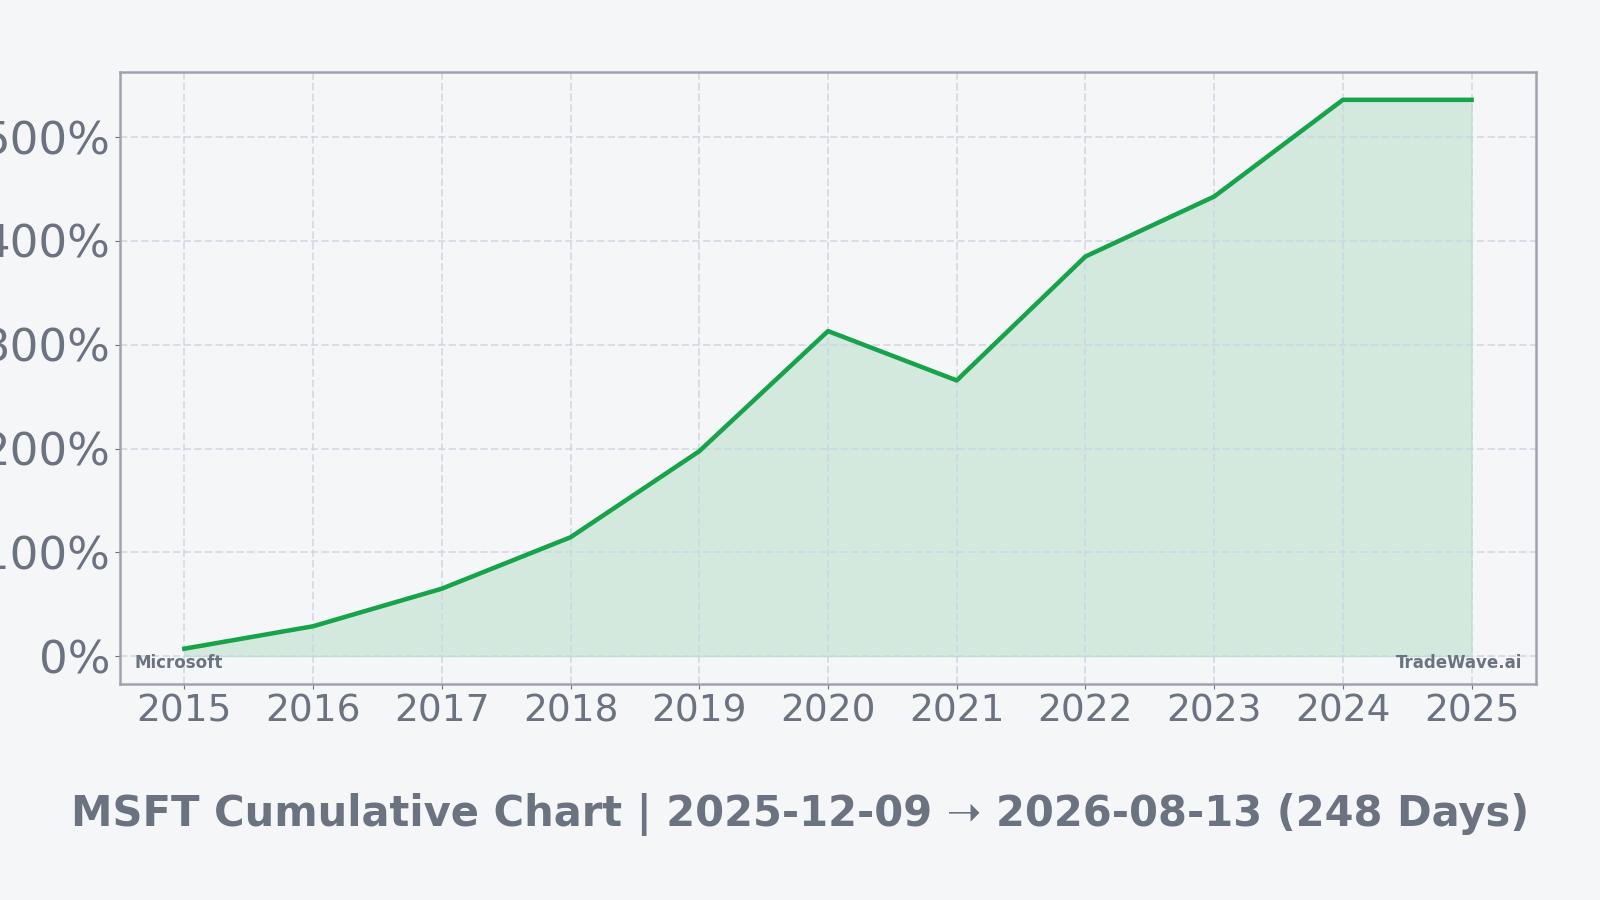
The 10-year average seasonal trend chart suggests that gains in this window have tended to build steadily rather than in a single burst, with the typical path showing early strength that often extends through the middle of the period before flattening out. That pattern implies that, in prior years, investors who were positioned early in the window often saw the bulk of the move accrue over several months rather than around a single event.
A combined view of net returns, peak rallies and worst drawdowns by year highlights how upside and downside have coexisted inside this window.
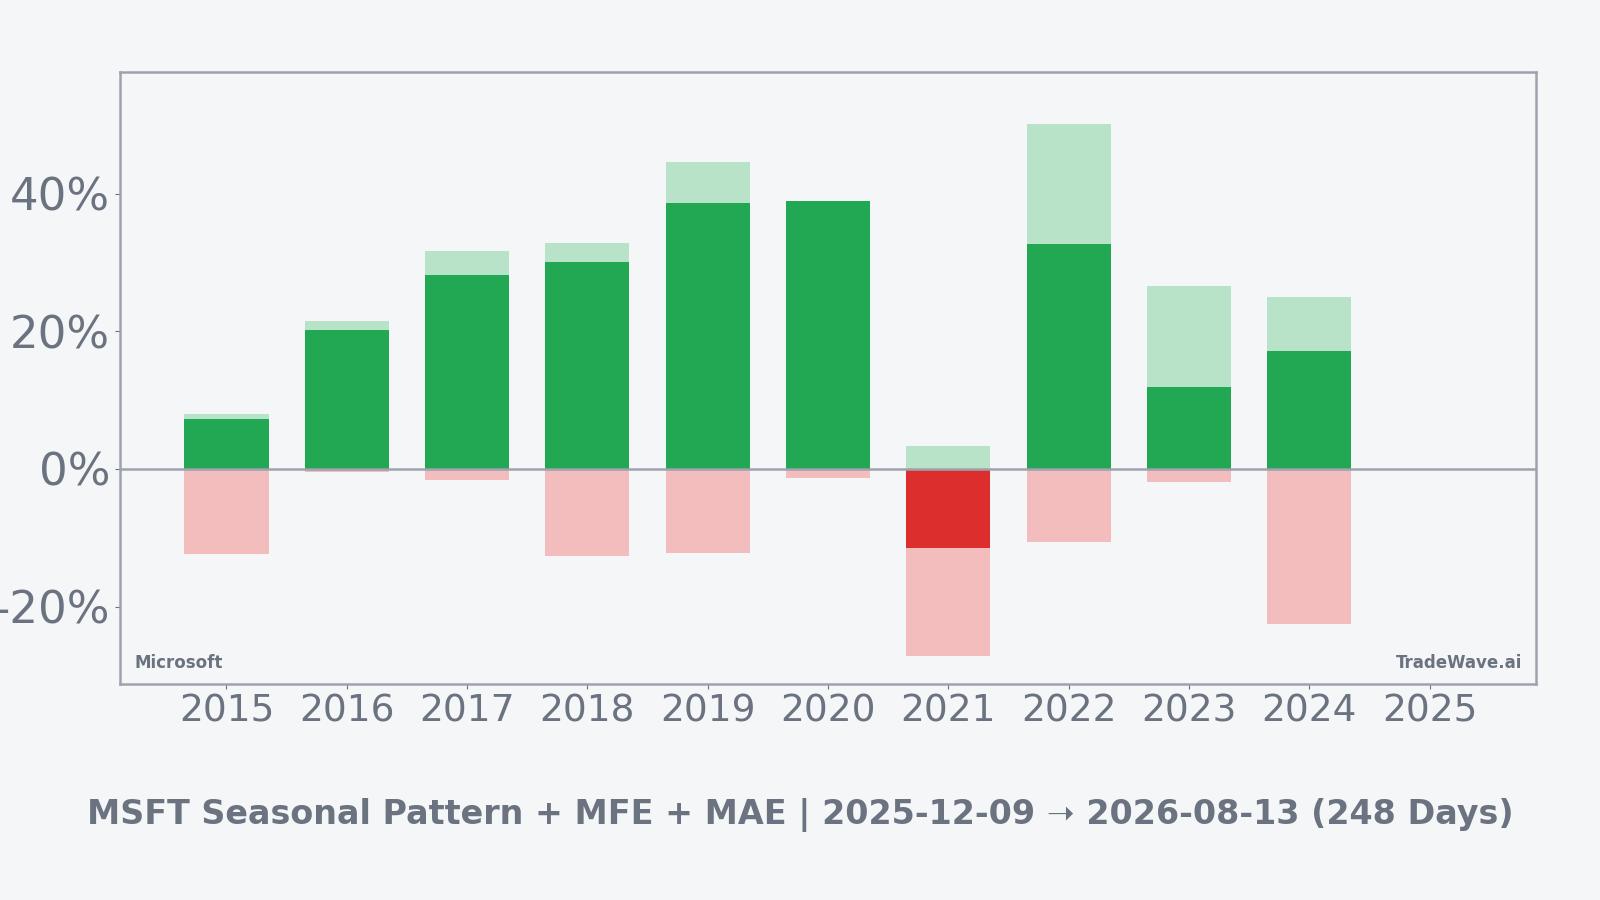
The combined net, maximum favorable and maximum adverse excursion bars show that in many years Microsoft has experienced sizable rallies inside the window, with MFE readings above 30% in 2017, 2018, 2019, 2020 and 2022, while MAE values have at times exceeded 10% and even 20% in weaker stretches such as 2015, 2018, 2019, 2021 and 2024. That mix of large positive and negative swings suggests a regime where the trade direction has historically been favorable for longs, but where intraperiod volatility and drawdowns have been meaningful even in years that ultimately finished higher.
History does not guarantee future results; adverse excursions (MAE) can be large even in winning windows.
Taken together, the historical pattern defines the quantitative seasonal backdrop for the current period.
Price and near-term drivers
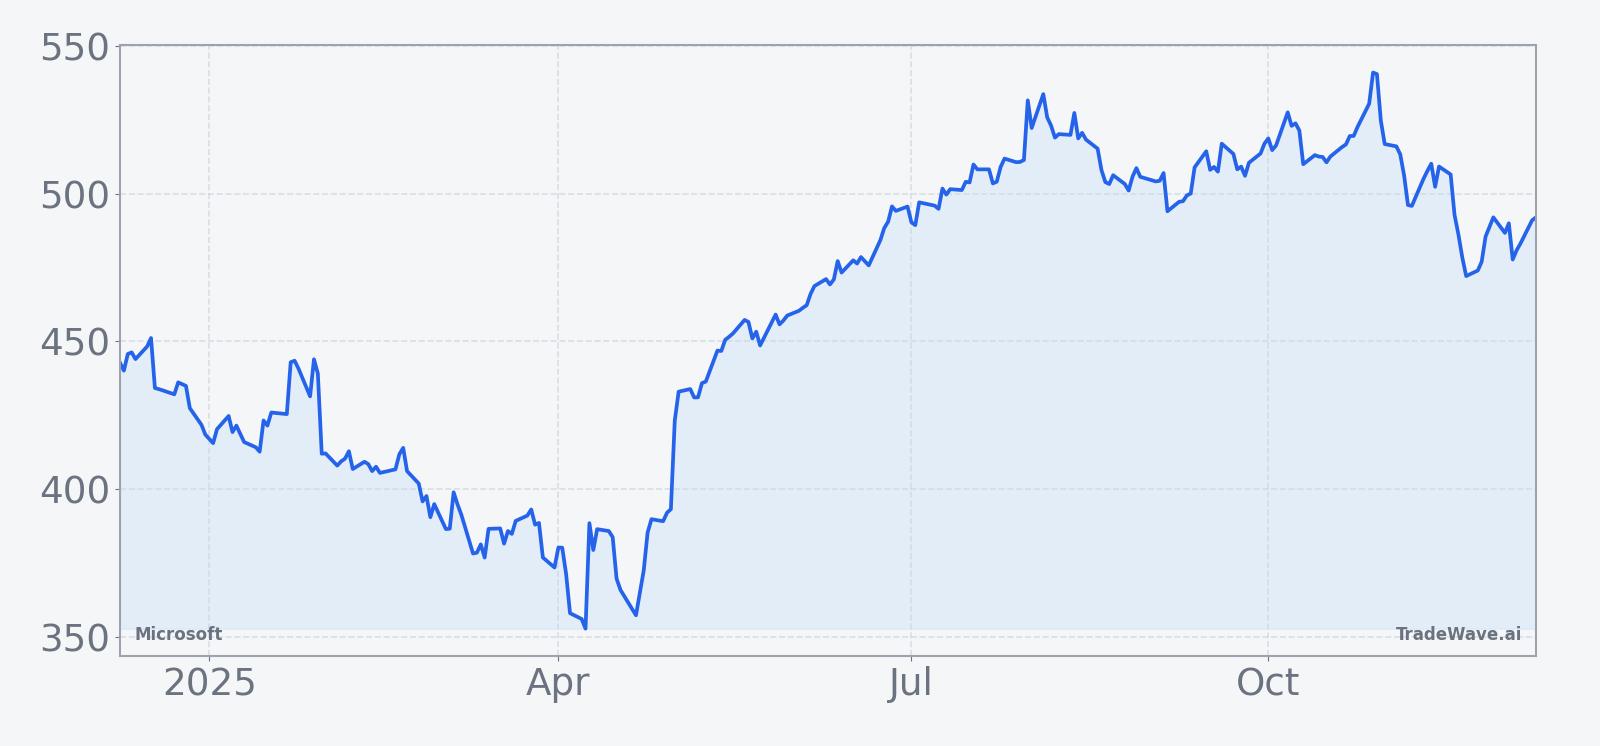
Microsoft shares recently changed hands around $534.05, up about 4.05% on the session and roughly 19% year to date, as investors continue to reward the company for its role at the center of the artificial intelligence and cloud computing boom.[3][5] The stock has been volatile around earnings and spending headlines, but the broader trend has remained constructive as investors look through near-term margin pressure to longer-term AI monetization.
The chart below situates the latest move in its recent multi-month context.
Fundamentally, Microsoft has delivered a string of earnings beats in 2025, even as management has guided to heavier investment in AI infrastructure. In its fiscal Q2 2025 report, the company posted revenue of $69.6 billion versus estimates of $68.8 billion and earnings per share of $3.23 versus $3.11 expected, though its outlook for Q3 came in below Wall Street forecasts and briefly pressured the stock.[3] More recently, fiscal Q4 2025 results showed revenue of $76.4 billion and EPS of $3.65, topping consensus estimates of $73.89 billion and $3.37 and sparking an 8% after-hours surge as investors focused on the strength of cloud and AI demand.[4]
Analysts have largely stayed positive through these swings. Firms including Wedbush, UBS and Bank of America maintain Buy or Outperform ratings, with a consensus price target around $600 that implies room for further upside from current levels.[1][5] Commentary has emphasized robust Q4 execution and confidence that elevated capital spending on AI infrastructure will translate into durable revenue and profit growth over time, even if it weighs on near-term free cash flow.
On the macro and sector front, Microsoft remains a bellwether for the broader technology and AI complex. Azure cloud growth has been a focal point, with recent figures showing 39% expansion versus a 40% bogey that some investors had hoped to see, a slight miss that nonetheless underscores the scale of demand for AI-enabled cloud services.[5] More broadly, Microsoft is viewed as a leader in AI sector expansion, helping to support sentiment across large-cap tech even as investors grapple with higher rates, regulatory scrutiny and uneven global growth.[2]
Fundamentals, valuation and the seasonal backdrop
With the stock near record highs and up strongly for the year, valuation remains a key talking point. While specific multiples are not detailed in the latest data, commentary from major outlets has framed Microsoft as a premium-priced AI leader whose earnings growth and balance sheet strength justify a higher-than-average multiple relative to the broader market.[1][2] That premium has at times made the stock sensitive to any hint of slowing cloud growth or heavier-than-expected spending, as seen when announcements around AI-related capital expenditures briefly knocked the shares lower earlier in the year.[5]
Against that backdrop, the current seasonal window provides an additional lens on risk and opportunity. Historically, this 248-day stretch has coincided with multiple earnings reports, product announcements and macro data releases that can act as catalysts for large moves in either direction. The fact that the window has produced 9 winning years and only 1 losing year for long positions suggests that, in prior cycles, those catalysts have more often resolved in favor of the bulls, but the presence of double-digit intraperiod drawdowns in several years is a reminder that the path has rarely been smooth.
For a mega-cap like Microsoft that exerts significant influence on major indices and sector ETFs, the combination of a strong historical seasonal bias and elevated volatility inside the window can matter beyond the stock itself. In years when Microsoft has rallied sharply during this period, it has often helped pull broader technology benchmarks higher, while the lone losing year in 2021 coincided with a more challenging environment for growth stocks and contributed to choppier index-level performance.[2][3]
According to historical data from TradeWave.ai, this multi-quarter stretch has shown a distinct upside bias for Microsoft in prior years, with sizable rallies often unfolding alongside meaningful drawdowns. The seasonal profile does not predict outcomes, but it adds a quantitative backdrop to the current mix of AI-driven growth, elevated expectations and index-level importance.
What to watch
For the remainder of this 248-day window, investors will be watching how Microsoft trades around upcoming earnings updates, particularly any new detail on AI monetization, Azure growth and capital spending plans.[3][4][5] The historical pattern suggests that large moves, both positive and negative, have often clustered around such catalysts, contributing to the sizable maximum favorable and adverse excursions seen in prior years.
Key levels to monitor include the recent highs near the current $534 area and any subsequent consolidation zones that develop if the stock pauses after its latest run. In past years, strong seasonal windows have often featured periods of digestion before another leg higher, while the lone losing year saw early strength give way to a deeper and more persistent drawdown. How Microsoft behaves around earnings and macro headlines in this window will help indicate whether the current year is tracking closer to the majority of winning years or to the outlier.
From a broader market perspective, Microsoft’s role as a core AI and cloud leader means that volatility in this seasonal window can ripple through technology indices and sentiment toward growth stocks more generally.[2][5] If the stock continues to respond positively to AI-related news and maintains its uptrend, it would be consistent with the historical pattern of strong performance in this regime; a sustained break lower, particularly if accompanied by disappointing cloud or AI metrics, would look more like the weaker historical episodes.
Ultimately, the seasonal data frame this as a period in which Microsoft has often delivered substantial gains for long positions, but with enough intraperiod downside to test conviction. Traders and investors who track the name closely will be weighing each new earnings report, AI announcement and macro data point against that backdrop as the current window unfolds.
Sources
- [1] Seeking Alpha, “Microsoft keeps Outperform rating as Wedbush sees 'robust' Q4 results” (Jul 25, 2025).
- [2] Forbes, “Buy MSFT Stock At $500?” (Aug 27, 2025).
- [3] Forbes, “What’s Happening With MSFT Stock?” (Jan 30, 2025).
- [4] Business Insider, “Microsoft Stock Surges After It Posts Another Earnings Beat” (Jul 30, 2025).
- [5] CNBC, “Microsoft's spending plans sent the stock lower. Here’s how analysts reacted” (Oct 30, 2025).
- [6] Yahoo Finance, “IBN Announces Latest Episode of The MiningNewsWire Podcast” (Jul 31, 2025).
- [7] Yahoo Finance, “Novo Nordisk (NVO) Sell-Off Wipes Billions in Market Value” (Jul 30, 2025).
- [8] TradeWave.ai, “MSFT Price Chart | Past 12 Months (actual price)” (Dec 9, 2025).
- [9] TradeWave.ai, “MSFT Seasonal Trend | 10-year average” (Dec 9, 2025).
- [10] TradeWave.ai, “MSFT Return Bars | Net with MFE and MAE” (Dec 9, 2025).
- [11] TradeWave.ai, “MSFT Return Bars | Per-Year Net” (Dec 9, 2025).
- [12] TradeWave.ai, “MSFT Cumulative Return | Pattern Window” (Dec 9, 2025).
- [13] TradeWave.ai, “MSFT Pattern Stats | Summary” (Dec 9, 2025).
- [14] TradeWave.ai, “MSFT Chart | hero” (Dec 9, 2025).